Launch Watch · Launch Watch · Evidence study
Published
Antarctic sea-ice extent grew by nearly the same amount in 2023 and 2024
Sea Ice Index Version 4 daily data show Antarctic minimum-to-maximum gains of 15.261 and 15.263 million km² in 2023 and 2024, despite different starting minima.
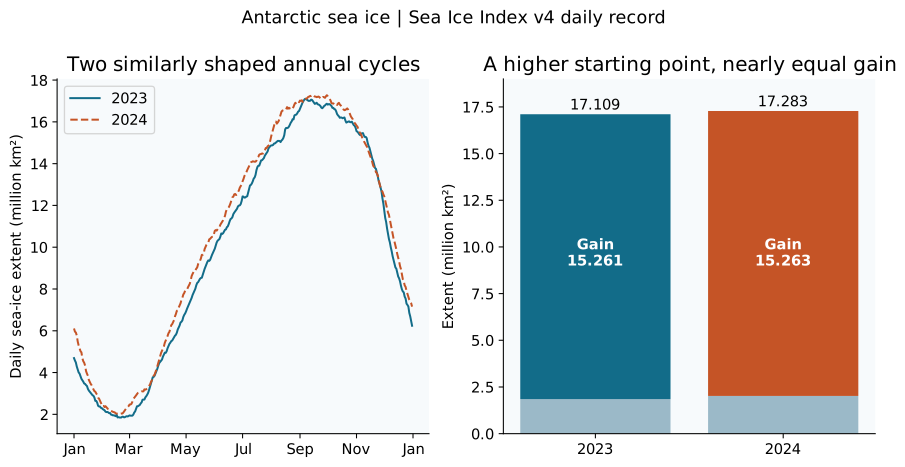
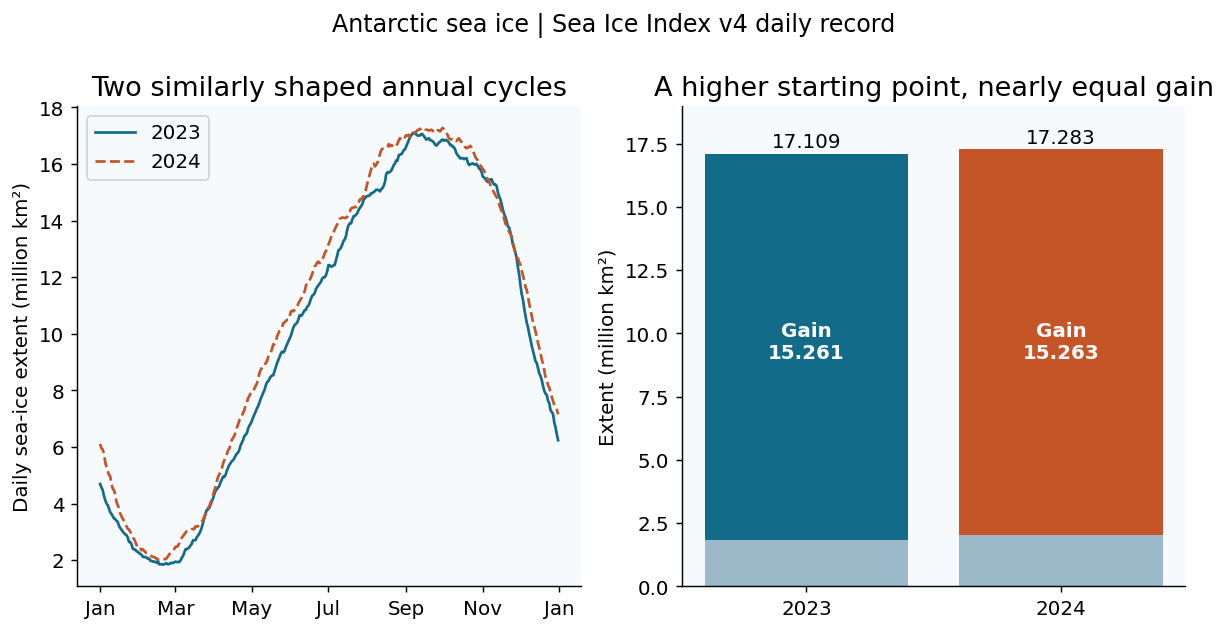
Antarctic sea-ice extent reached a higher annual maximum in 2024 than in 2023 in the downloaded Sea Ice Index Version 4 daily record. But the gain from each year’s minimum to its maximum was almost identical: 15.261 million square kilometres in 2023 and 15.263 million in 2024.
The higher starting point explains nearly all the difference between the two maxima in this endpoint comparison. The 2024 minimum is 0.172 million square kilometres higher; its maximum is 0.174 million higher. Looking only at the maximum would miss that starting-point context.
Open full-size figure · Download PNG figure
Decompose the maximum into a starting extent and a gain
In the unsmoothed daily record, 2023’s minimum is 1.848 million square kilometres on 21 February. Its maximum is 17.109 million on 7 September. Subtracting minimum from maximum gives 15.261 million square kilometres across 198 elapsed days.
For 2024, the corresponding endpoints are 2.020 million square kilometres on 17 February and 17.283 million on 15 September. The gain is 15.263 million square kilometres across 211 elapsed days. The chart’s pale bar bases show the minima, with the colored segments showing the endpoint gains.
| Year / series | Minimum (date) | Maximum (date) | Endpoint gain | Days between extrema |
|---|---|---|---|---|
| 2023 / daily | 1.8480 (2023-02-21) | 17.1090 (2023-09-07) | 15.2610 | 198 |
| 2023 / centered 5-day mean | 1.8536 (2023-02-19) | 17.0650 (2023-09-07) | 15.2114 | 200 |
| 2024 / daily | 2.0200 (2024-02-17) | 17.2830 (2024-09-15) | 15.2630 | 211 |
| 2024 / centered 5-day mean | 2.0292 (2024-02-18) | 17.2564 (2024-09-14) | 15.2272 | 209 |
The small difference is arithmetic, not a physical finding
The two unsmoothed gains differ by 0.002 million square kilometres, or 2,000 square kilometres. That is about 0.013% of the 2023 gain. The calculation can be reproduced from the published values, but the tiny difference should not be treated as a meaningful physical distinction on the basis of rounded extent data.
The useful observation is that the gains are nearly equal under this convention. It does not require pretending the final decimal is a precise measure of a difference in the ice system.
Check whether smoothing changes the story
A centered five-day arithmetic mean changes the extrema and some of their dates. In that sensitivity check, the gains are 15.2114 million square kilometres for 2023 and 15.2272 million for 2024, a difference of 0.0158 million.
The exact numbers are therefore convention-dependent, while the near-equal-gain interpretation survives this particular smoothing check. The table labels the daily and five-day results separately so that a reader does not accidentally compare one year’s raw daily minimum with another year’s smoothed maximum.
Historical news summaries may use a different data version or smoothing convention. These Version 4 raw daily extrema should not silently replace the values in those reports. Start a numerical comparison by matching the dataset version, field and averaging rule.
How the endpoint calculation works
We use the NOAA/NSIDC Sea Ice Index, Version 4 Southern Hemisphere daily CSV and select complete calendar years 2023 and 2024 without interpolation. For each year, we find the minimum and maximum of Extent, subtract them and calculate the elapsed calendar days between the dates.
The sensitivity calculation requires five observations for each centered five-day mean before finding its extrema. The downloadable daily file preserves the source Missing column. That column describes missing grid area; it is not a complete summary of uncertainty in the concentration data or any infilling.
Extent gain cannot measure total ice production
Sea-ice extent counts ocean area meeting the product’s concentration threshold. It does not measure ice thickness, mass or volume. Freezing and melting can both occur through the season, so maximum minus minimum cannot recover the total quantity of ice formed along the way.
Nor does this two-year endpoint comparison establish a trend, ecosystem recovery or a return to normal conditions. It answers one narrower question: how much did the extent increase between each selected year’s annual minimum and maximum, under a specified data convention?
Data citation: Fetterer, F., Knowles, K., Meier, W. N., Savoie, M., Windnagel, A. K. and Stafford, T. (2025). Sea Ice Index, G02135, Version 4. National Snow and Ice Data Center. DOI: 10.7265/a98x-0f50. Southern Hemisphere daily extent, 2023–2024; accessed 6 October 2026.
Sources and data
Source snapshots were retrieved on 6 October 2026. The observation dates and product versions are stated above; retrieval does not make a historical record current.
- NOAA/NSIDC Sea Ice Index Southern Hemisphere daily extent (G02135 Version4.0)
- Sea Ice Index user guide (Version4; daily CSV conventions)
- Sea Ice Index dataset citation (G02135 Version4)
- NSIDC data policies (Open scientific data policy)
Download B455-antarctic-season-summary.csv (CSV) · Download B455-antarctic-daily.csv (CSV) · Download south_daily.csv (CSV)