Launch Watch · Launch Watch · Evidence study
Published
Apollo 13 and 16 entered at almost the same speed, with different peak g
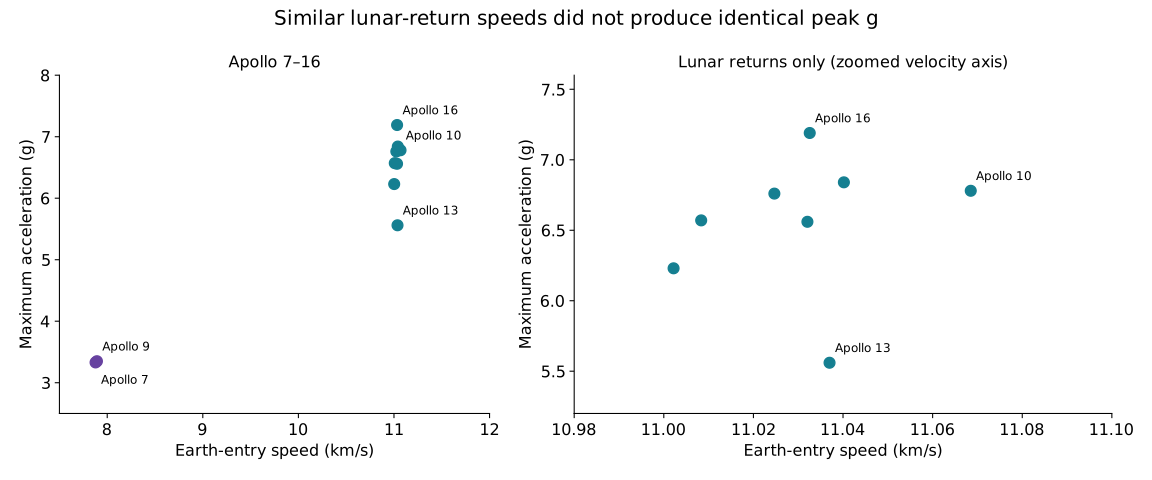
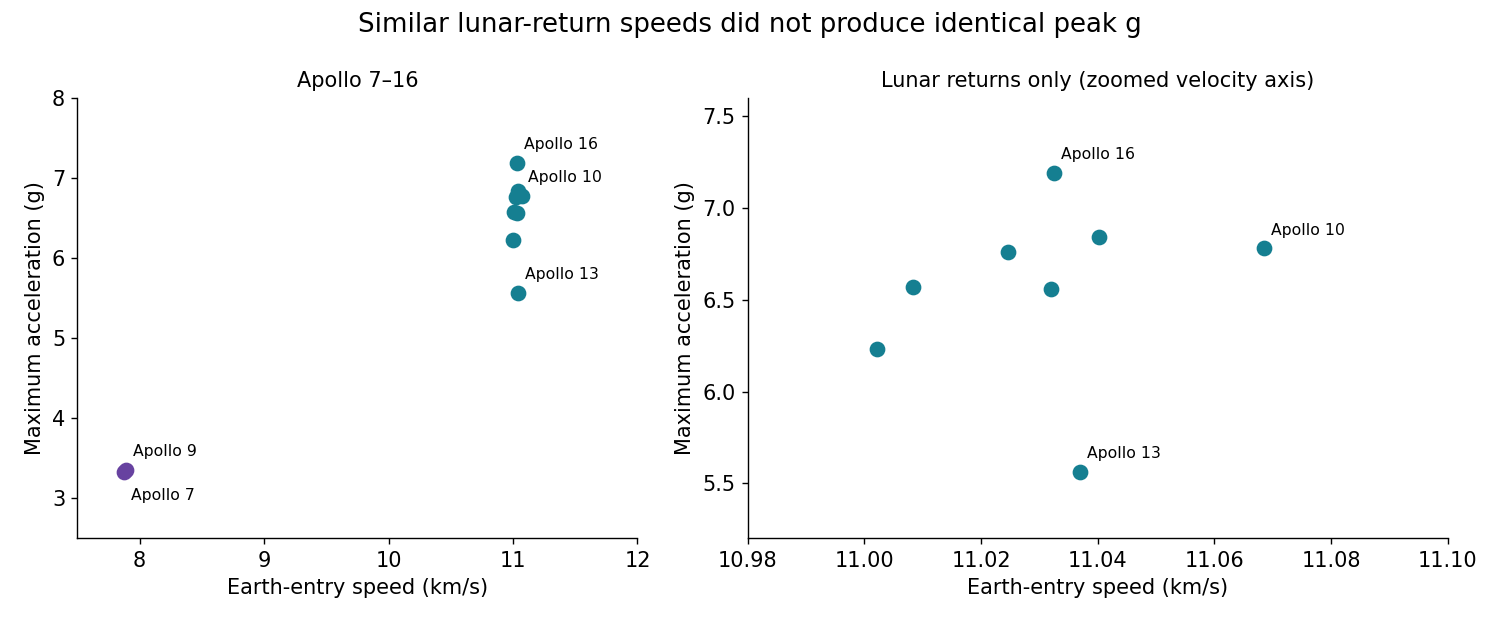
NASA’s Apollo statistics put Apollo 13 and 16 entry speeds only 0.040% apart, while maximum acceleration differs from 5.56 g to 7.19 g.
Apollo 13 and Apollo 16 reached Earth entry at almost the same tabulated speed: 36,210.6 and 36,196.1 feet per second. The difference is just 14.5 feet per second, about 0.040% of Apollo 13’s value. Their reported maximum accelerations are farther apart: 5.56 g and 7.19 g.
Putting the two columns side by side illustrates a useful limit. One entry-speed value does not determine a flight’s peak deceleration by itself. The historical comparison can demonstrate that limitation without claiming to explain every trajectory difference.
Open full-size figure · Download PNG figure
Keep the Earth-orbit returns separate
We transcribed the Earth Entry Velocity and Maximum g rows from Richard W. Orloff’s Apollo by the Numbers, NASA/SP-2000-4029, printed page 305, which is page 315 of the PDF.
The table includes Apollo 7 and Apollo 9 as clearly marked Earth-orbit returns. Their speeds are about 7.88–7.89 kilometres per second and maximum accelerations about 3.33–3.35 g. The eight selected lunar returns cluster near 11 kilometres per second, so combining all ten without labeling return class would hide an important difference in the sample.
| Mission | Return class | Entry velocity (ft/s) | Entry velocity (km/s) | Maximum g |
|---|---|---|---|---|
| Apollo 7 | Earth orbit | 25846.4 | 7.8780 | 3.33 |
| Apollo 8 | Lunar return | 36221.1 | 11.0402 | 6.84 |
| Apollo 9 | Earth orbit | 25894 | 7.8925 | 3.35 |
| Apollo 10 | Lunar return | 36314 | 11.0685 | 6.78 |
| Apollo 11 | Lunar return | 36194.4 | 11.0321 | 6.56 |
| Apollo 12 | Lunar return | 36116.618 | 11.0083 | 6.57 |
| Apollo 13 | Lunar return | 36210.6 | 11.0370 | 5.56 |
| Apollo 14 | Lunar return | 36170.2 | 11.0247 | 6.76 |
| Apollo 15 | Lunar return | 36096.4 | 11.0022 | 6.23 |
| Apollo 16 | Lunar return | 36196.1 | 11.0326 | 7.19 |
Zoom in on the lunar-return cluster
Across the eight selected lunar returns, tabulated Earth-entry speed ranges from 36,096.4 feet per second for Apollo 15 to 36,314 for Apollo 10. The upper endpoint is about 0.603% above the lower. Maximum g ranges from 5.56 for Apollo 13 to 7.19 for Apollo 16, about 29.3% higher at the upper endpoint.
Those percentage ranges use the smaller value as the denominator. They are descriptive comparisons, not measures of statistical uncertainty. The chart’s lunar-only panel uses a deliberately narrowed velocity axis to make the tightly clustered speed values visible; it should be read with its axis labels.
The table also prevents a visual shortcut. Apollo 10 has the largest Earth-entry speed in this selected set, but Apollo 16 has the largest maximum g. Ranking by one field does not reproduce the ranking by the other.
Which source row is being used?
The reference contains separate rows for Earth Entry Velocity and Maximum Entry Velocity. This analysis consistently uses the complete Earth Entry Velocity row. Substituting values from the other row partway through the table would mix definitions and introduce missing-data problems.
We retain each speed’s printed precision, verify the transcription against the rendered source page and convert feet per second to kilometres per second with the exact factor 0.0003048. The CSV preserves both units and the source-page locator.
The plot shows all ten selected missions, with a second view of only the eight lunar returns. It does not select only the Apollo 13–16 pair to establish the larger pattern, even though that pair gives the clearest opening example.
Why Apollo 17 is absent
The source’s footnote 58 warns that some Apollo 17 entry data are preflight predictions. Rather than guessing which fields can safely be treated as measured, this comparison excludes Apollo 17 entirely. Its absence is a documented scope choice, not a missing row to fill from an unlabeled secondary source.
Peak g is only one part of an entry
Maximum g describes a peak acceleration measure in this table. It does not give total thermal load, maximum heating rate or total absorbed energy. The two-variable scatter also cannot tell us which flight-path or guidance differences caused the variation in peak g.
The supported result is that nearly equal tabulated Earth-entry speeds coexist with different maximum accelerations in these Apollo records. Explaining the causes would require the corresponding trajectory and guidance histories. Keeping that next question separate lets the historical numbers teach a real lesson without turning them into a causal model of atmospheric entry.
Sources and data
Source snapshots were retrieved on 6 October 2026. The observation dates and product versions are stated above; retrieval does not make a historical record current.