Launch Watch · Earth
Published
Same Arctic ice area, different extent: September 2016 and 2024
Arctic sea-ice area is 2.91 million km² in both September rows, but extent falls 4.0%. Reproduce the NSIDC comparison and see why both can be true.
September 2016 and September 2024 share the same published Arctic sea-ice area: 2.91 million square kilometers. Their sea-ice extents differ by 180,000 square kilometers. The 2024 extent is about 4.0% smaller.
Both statements come from the same NSIDC September data file. They can coexist because area and extent count ice-covered grid cells differently. This two-year comparison makes that distinction concrete, while showing why equal rounded totals need careful wording.
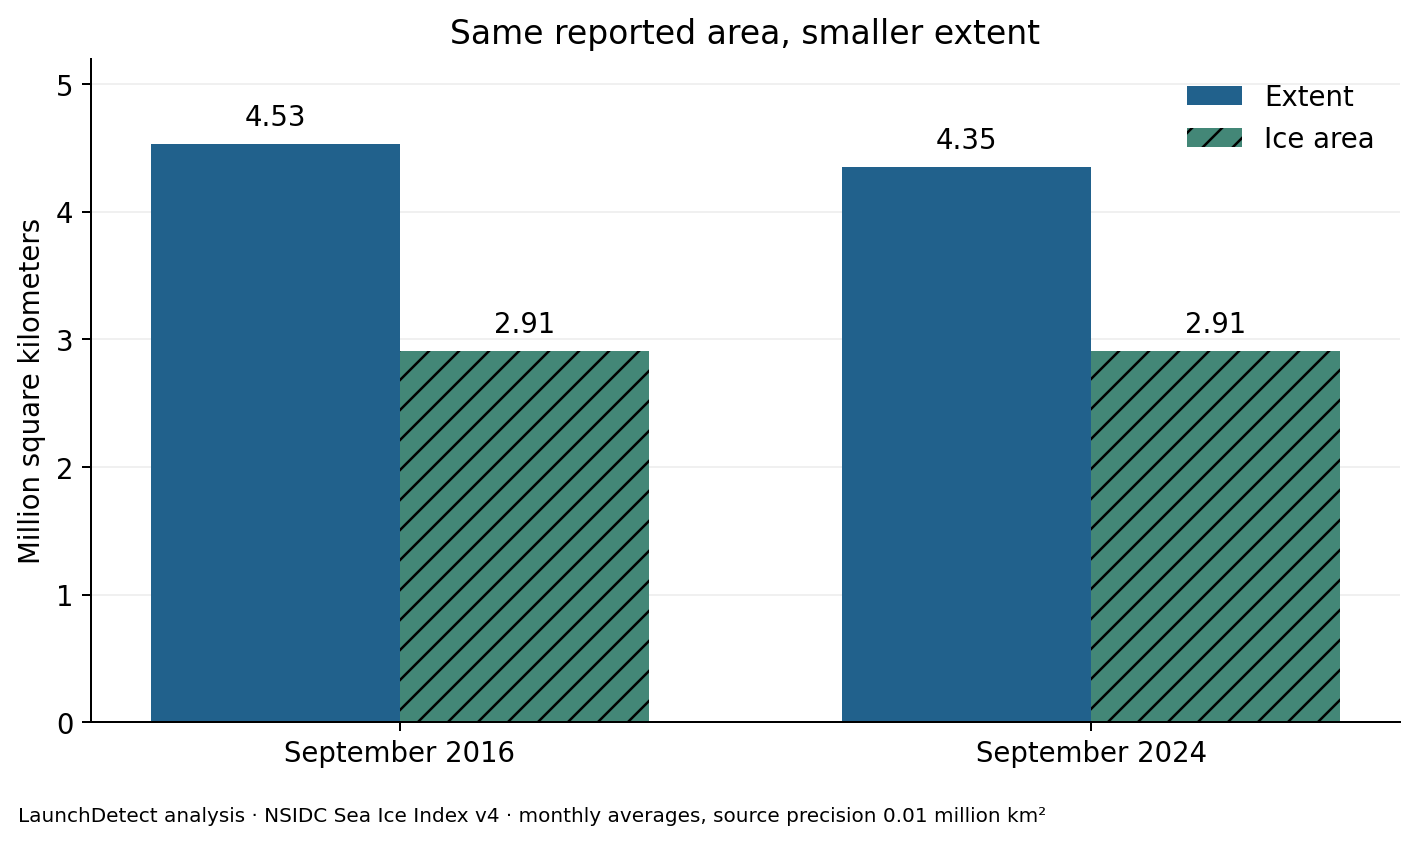
The comparison in four numbers
| September | Extent (million km²) | Area (million km²) | Source dataset |
|---|---|---|---|
| 2016 | 4.53 | 2.91 | NSIDC-0051 |
| 2024 | 4.35 | 2.91 | NSIDC-0051 |
Subtract 4.53 from 4.35 and the extent change is −0.18 million km². Dividing that difference by the 2016 extent gives −3.9735%, or about −4.0%. The area difference is 2.91 − 2.91 = 0.00 million km² at the precision of the published file. Download these two source rows as CSV.
These are September monthly averages, not measurements from the day of the annual minimum. We selected the same month, the same Sea Ice Index version and rows with the same source-dataset code, NSIDC-0051. We did not mix a daily minimum from one year with a monthly average from another.
The two-row example answers a question about the metrics. It does not establish a trend from just two selected years, estimate ice thickness or measure a change in ice volume.
Extent counts qualifying cells; area weights their ice fraction
The Version 4 user guide, section 3.1.6, describes the calculation behind these CSV columns. For each day, a grid cell passing the 15% ice-concentration cutoff contributes its full cell area to extent. For ice area, concentration weights that contribution. Daily hemisphere-wide totals are then averaged over the month.
That distinction lets the two totals move differently. A change in the number and size of qualifying cells affects extent. A change in concentration within those cells affects area as well. Different distributions can therefore yield the same reported ice area with different extents. Our selected totals demonstrate that outcome; they do not identify the exact redistribution of ice that produced it.
The Arctic pole hole adds another difference. The satellite does not observe this small region around the pole. NSIDC includes it as ice-covered for extent, while excluding it from area because its concentration is unknown. Dividing the published area by extent would consequently mix different spatial treatment with the temporal aggregation. We do not label that ratio an observed mean ice concentration.
Look at the maps without counting their colored pixels
The two original concentration maps below help locate the ice and show its spatial texture. Both print an area rounded to 2.9 million km², a coarser label than the CSV’s 2.91. Their matching display labels are consistent with the table but offer less numerical precision.
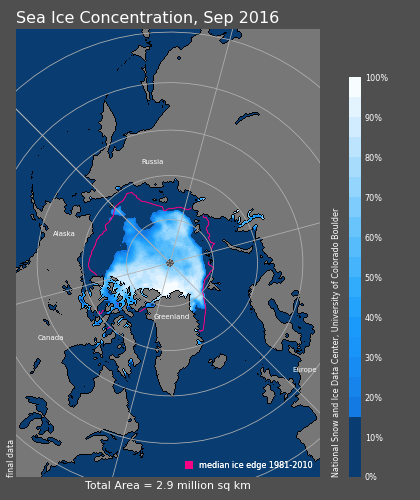
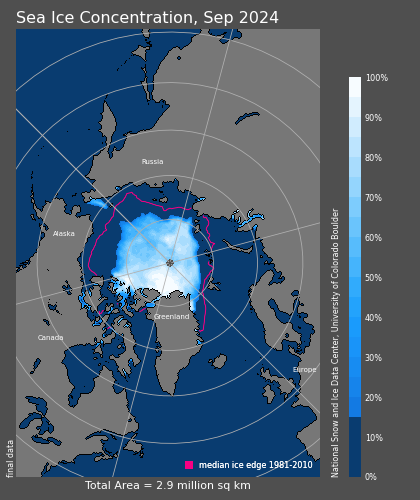
A monthly concentration map and a monthly average of daily extent totals are different aggregations. A location that is ice-covered for part of September can have an intermediate monthly mean concentration. Applying a threshold to that monthly mean field need not give the same result as thresholding each daily field before averaging its total. Add the map’s rendering and labels, and counting colored pixels becomes a different calculation again.
For that reason, our arithmetic uses the CSV. The maps are preserved as source imagery rather than transformed into a new area estimate. They support a geographic reading without pretending that display colors recover the underlying daily measurements.
What “the same area” can safely mean
The CSV reports area in steps of 0.01 million km², equivalent to 10,000 km². Two values displayed as 2.91 can have different unrounded values. There is no basis here to call the underlying areas exactly equal, and the number of printed digits is not a statement of measurement accuracy.
A useful summary is: September 2024 had 0.18 million km² less reported extent than September 2016, while reported area was unchanged at 2.91 million km². It keeps the observed comparison, the units and the precision together.
This example also ends before the source transition represented in Version 4 for 2025 onward. Extending the comparison into later years calls for reading that continuity documentation, rather than assuming a matching column name guarantees identical inputs.
Reproduce the result
Open the linked September CSV, retain years 2016 and 2024, and verify that both month fields are 9 and both source-dataset fields are NSIDC-0051. Subtract each 2016 value from its 2024 counterpart. For the relative extent change, divide −0.18 by 4.53 and multiply by 100. No image classification, fitted model or downloaded chart values enter those calculations.
Data citation: Fetterer, F., Knowles, K., Meier, W. N., Savoie, M., Windnagel, A. K. and Stafford, T. (2025), Sea Ice Index, G02135, Version 4, National Snow and Ice Data Center. Subset: Northern Hemisphere September monthly area and extent, 2016 and 2024; accessed 4 October 2026. Chart and calculations are by LaunchDetect. Source images and data are used with attribution under NSIDC’s citation and image-use policy.