Launch Watch · Current evidence
Published
One Bondville pixel, two different vegetation seasons
Compare 2012 and 2013 MODIS NDVI at one fixed pixel, with quality gaps, selected-observation dates and a reproducible 36-composite download.
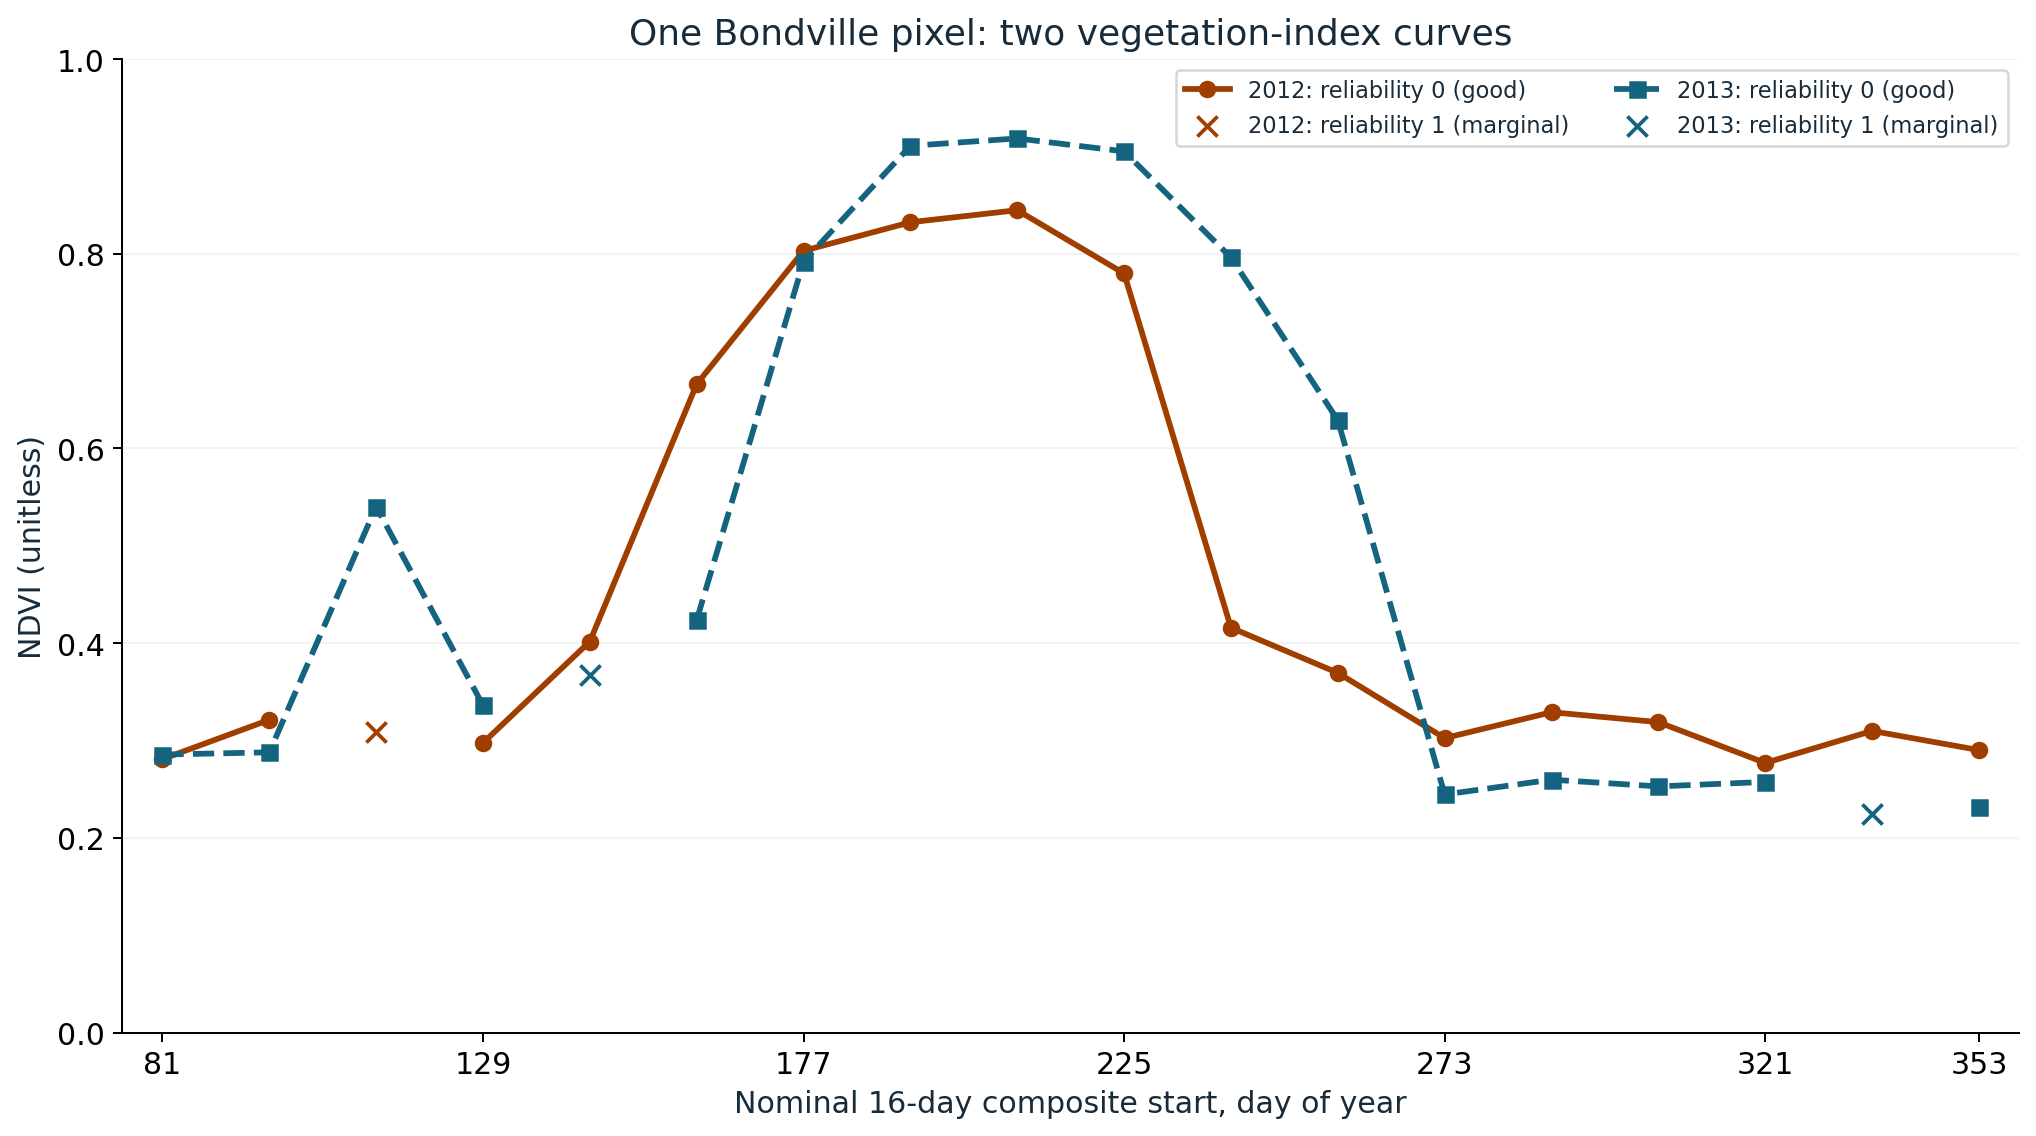
One MODIS vegetation-index pixel near Bondville, Illinois, followed noticeably different late-summer curves in 2012 and 2013. Between the nominal day-225 and day-241 composites, its NDVI fell from 0.7797 to 0.4158 in 2012. The corresponding 2013 values were 0.9051 and 0.7961.
The drop between those two entries is 0.3639 index units in the first year and 0.1090 in the second. That is a reproducible difference in seasonal shape. Explaining why the curves differ requires information beyond the satellite extract, such as field management and weather records.
Keep the pixel and nominal sequence fixed
The requests use 40.0062°N, 88.2904°W, near Bondville, Illinois. Each response contains one row and one column on the MODIS sinusoidal grid. The returned grid-cell spacing is approximately 231.66 metres, within the product family commonly described as 250-metre vegetation indices.
We selected 18 nominal composite starts per year, from day 81 through day 353 in steps of 16. The grid location is unchanged across all four request files. This holds the spatial selection and nominal sequence steady without assuming that every composite used an observation from the same relative day within its window.
A satellite grid cell can include a mixture of surfaces and need not coincide exactly with a field boundary or a ground instrument’s footprint. We do not assign a crop type to either year from this extract or present the result as an average over the Bondville region.
Three entries make the seasonal difference concrete
| Entry | 2012 | 2013 |
|---|---|---|
| Highest reliability-zero NDVI | 0.8447, nominal 27 July | 0.9184, nominal 28 July |
| Nominal day 225 | 0.7797, 12 August | 0.9051, 13 August |
| Nominal day 241 | 0.4158, 28 August | 0.7961, 29 August |
| Day-241 minus day-225 value | −0.3639 | −0.1090 |
The one-day offset between calendar labels is expected: 2012 was a leap year and 2013 was not. We align the plot by nominal day of year so that corresponding entries occupy the same horizontal positions. Readers matching a dated ground event should use the actual selected-observation field, discussed below, rather than this alignment alone.
NDVI is a unitless vegetation index constructed from red and near-infrared reflectance. The MOD13Q1 product documentation describes the vegetation-index layers and a compositing process that selects suitable observations within each period. A lower index value in this pixel is a change in the remotely sensed signal; converting it into crop yield or identifying harvest would need a separate, validated analysis.
Show the excluded points instead of hiding them
The MOD13 user guide, Table 4, defines the pixel-reliability summary. A value of 0 marks good data. A value of 1 marks marginal data and calls for attention to the other quality information. Other codes cover fill, snow/ice and cloud conditions.
The 2012 extract contains 17 reliability-zero composites and one marginal composite. The 2013 extract contains 16 reliability-zero composites and two marginal composites. The connected curves use only the reliability-zero points. We draw the marginal values as crosses and leave gaps in the lines at their positions, so their existence and the filtering decision remain visible.
This is a stated inclusion rule, not proof that every retained retrieval is error-free. The reader CSV keeps the detailed vegetation-index quality field as well as the summary flag. Another analysis can adopt a stricter rule and show how its conclusions change instead of silently replacing our selection.
A composite start is not the observation date
The largest retained 2012 NDVI belongs to the nominal 27 July composite, but its selected observation is day 219, or 6 August. The largest retained 2013 value belongs to the nominal 28 July composite, with its selected observation on day 223, or 11 August.
Both selected observations fall within their respective composite windows. The two dates answer different questions: the nominal start identifies the product interval, while the selected day identifies the contributing observation for that pixel. Saying that the vegetation “peaked on 27 July” would claim more temporal precision than this product supports.
This also explains why adjacent plotted points are not an uninterrupted record of daily vegetation condition. They are selected representatives of successive periods. The line is a guide connecting those entries, with quality gaps preserved; it does not fill in everything that happened between them.
Repeat the same-pixel comparison
Download all 36 composite entries. The file includes nominal dates, selected-observation dates, raw and scaled NDVI, the separately defined EVI, and quality fields. EVI is retained for transparency but is not substituted for NDVI in this comparison.
The ORNL DAAC web-service guide describes the subset interface. For this case, request MOD13Q1 at the stated coordinate with both spatial half-width parameters set to zero. Use A2012081–A2012225 and A2012241–A2012353 for 2012, and the same day-of-year ranges in 2013. The split requests cover the same 18-period sequence in each year.
Multiply the raw NDVI integer by 0.0001, join the bands by nominal date, and apply the reliability rule before finding maxima or drawing the connected curve. Keep the returned cell geometry and selected-observation days. The saved API responses do not expose a collection-version field, so the current V061 catalog is documentation context rather than an independently verified version label for these extracts.
The clear result is a different late-summer index trajectory at one fixed pixel. Crop rotation, management, weather and mixed-pixel effects are possible topics for further investigation; this article does not attribute the difference to any one of them.
Source credit: NASA MODIS MOD13Q1 and ORNL DAAC’s TESViS REST service, accessed 5 October 2026. This AI-assisted analysis and original graphics are LaunchDetect work, with no NASA or ORNL review or endorsement implied. No third-party imagery is reproduced.