Launch Watch · Launch Watch · Evidence study
Published
CNEOS fireball vectors: a complete-data filter removes 40% of the sample
A 405-record CNEOS audit shows how requiring entry-velocity data changes annual counts and energy mix, with original charts and downloadable calculations.
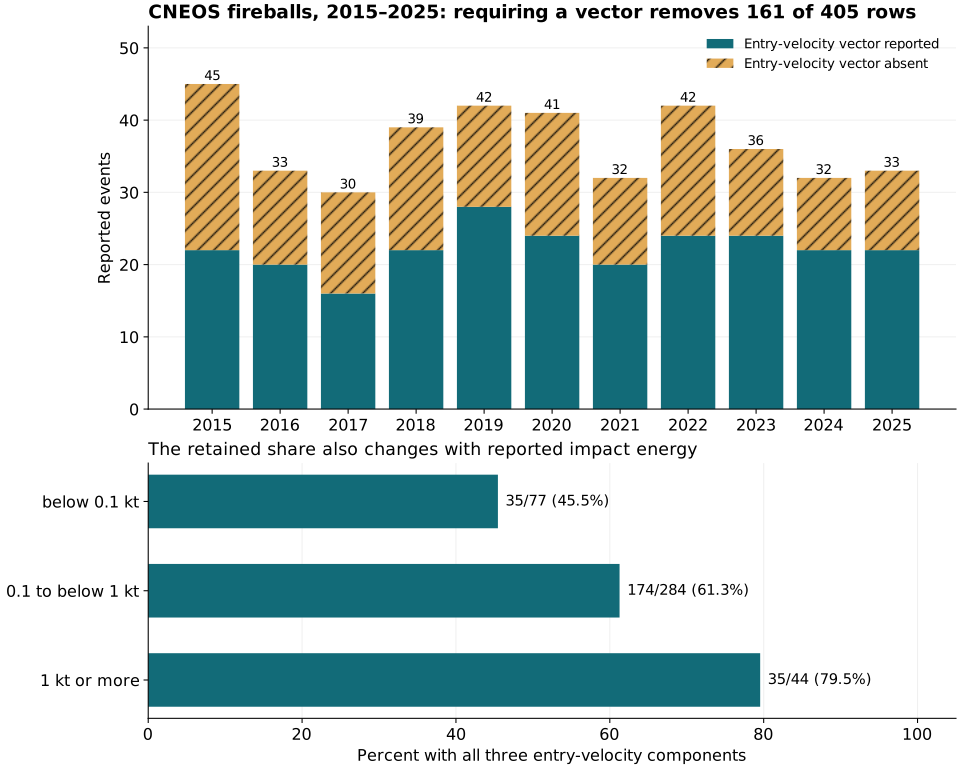
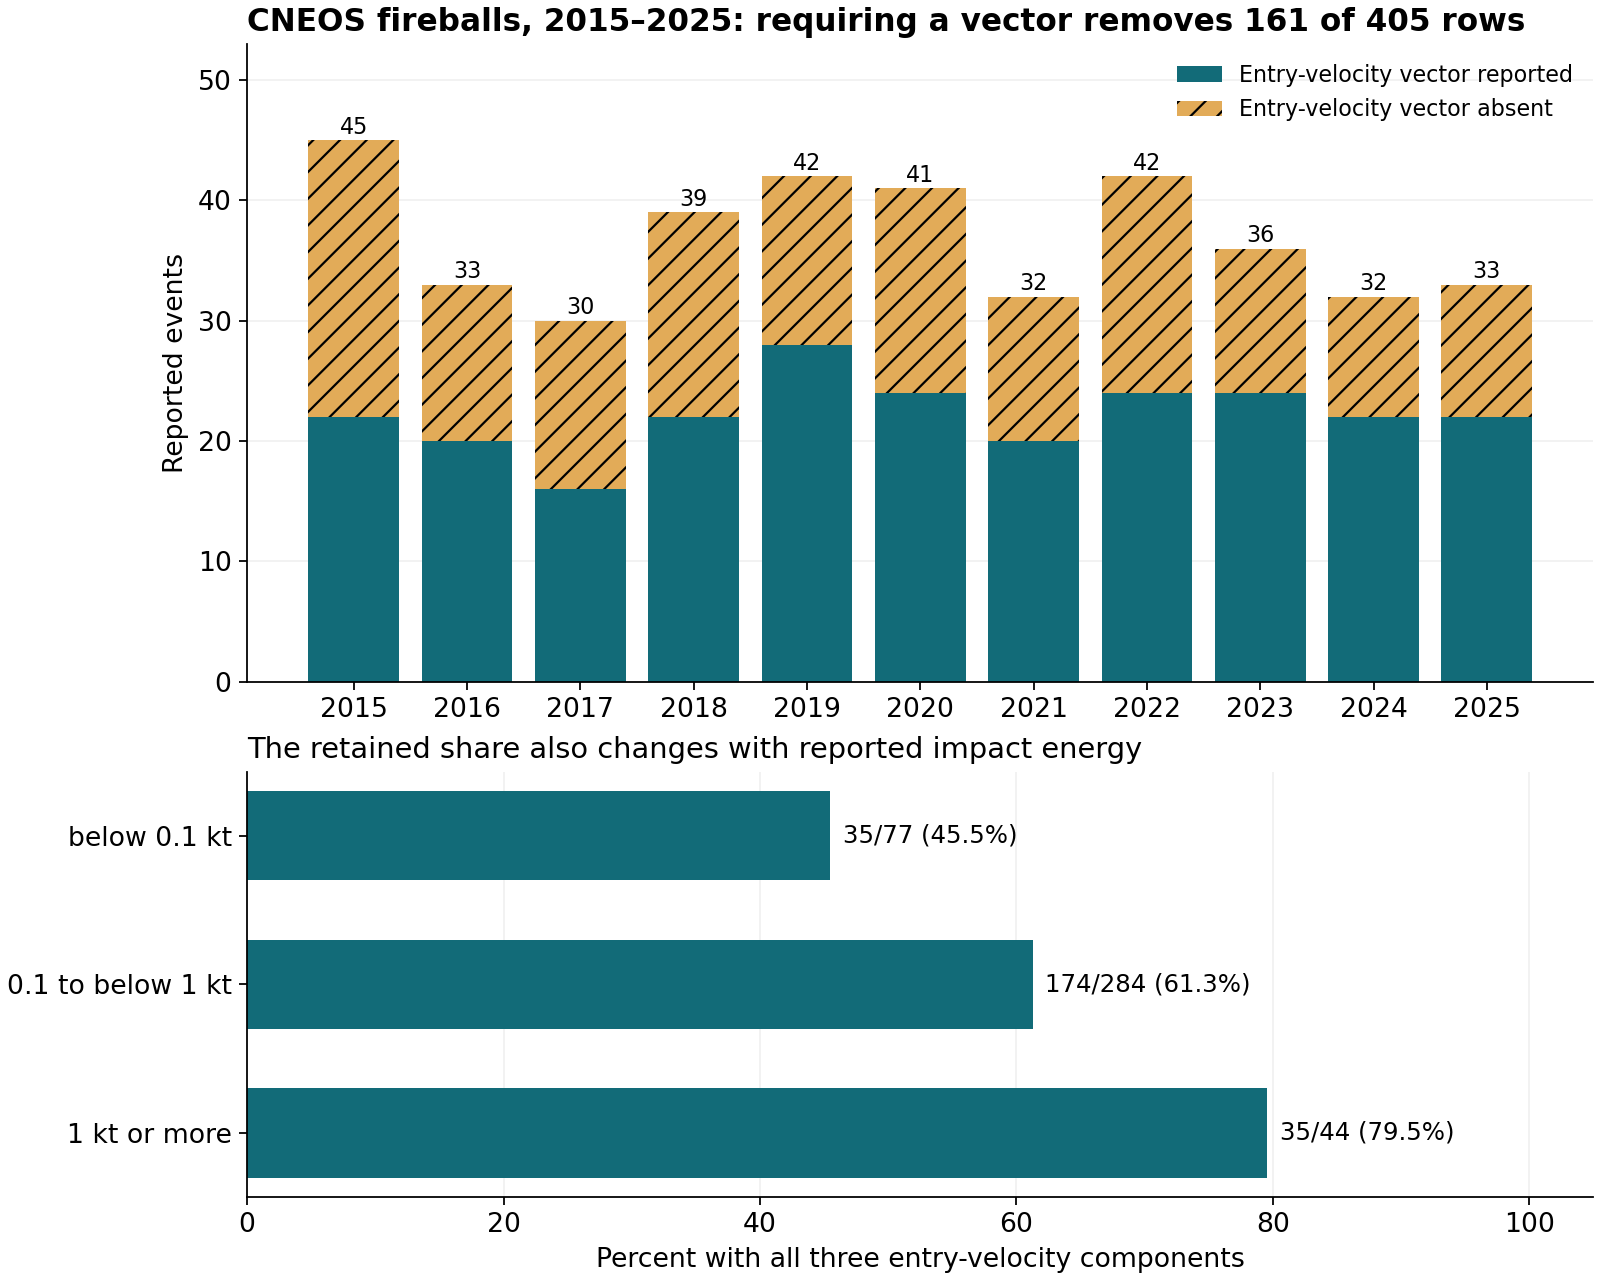
A fireball record can contain enough information to put a point on a map while still lacking the three velocity components needed to describe its entry direction. In our analysis of 405 CNEOS records dated 2015–2025, 398 have a geographic location, but only 244 have all three entry-velocity components. Requiring those components removes 161 records, or 39.75% of the starting sample.
The selection also changes the energy mix. Among events with calculated impact energy below 0.1 kilotons, 45.5% retain a velocity vector. Among events at or above 1 kiloton, 79.5% do. A map-ready dataset and a vector-ready dataset therefore answer questions about different selections of reported events.
Open the full-size chart · Download the PNG chart
Start with the 405 records before filtering
We requested every public API record from 1 January 2015 through 31 December 2025, including velocity components when available. The request did not require a location, altitude or vector. This preserves the original denominator rather than silently beginning with the rows most convenient for a particular analysis.
The Fireball Data API documentation distinguishes requesting velocity-component columns from requiring them to be populated. The date is the time of peak brightness. Geographic coordinates and altitude describe that event, and the version 1.2 documentation labels the components as entry velocity. Our analysis uses those labels without reconstructing a pre-atmospheric orbit.
| Required reported fields | Retained events | Share of all records |
|---|---|---|
| Date and both energy fields only | 405 | 100.00% |
| Geographic location | 398 | 98.27% |
| Altitude | 350 | 86.42% |
| All three entry-velocity components | 244 | 60.25% |
| Location, altitude and all three components together | 243 | 60.00% |
These are overlapping requirements, not categories to add together. A single row can satisfy several. The last requirement is stricter than the vector requirement: the record at 18:29:03 UTC on 20 September 2018 supplies a location and vector but no altitude. That one record explains the difference between 244 and 243.
Filtering changes the energy distribution
To test whether vector availability is uniform across this sample, we divided the records into three stated impact-energy ranges. The boundaries belong to this analysis; they are not claimed to be sensor thresholds. Every record falls into exactly one bin, including the boundary values.
| Impact-energy range | All records | With a vector | Retained share |
|---|---|---|---|
| Below 0.1 kt | 77 | 35 | 45.5% |
| 0.1 to below 1 kt | 284 | 174 | 61.3% |
| 1 kt or more | 44 | 35 | 79.5% |
The vector-reported group has a median calculated impact energy of 0.205 kt; the vector-absent group has a median of 0.14 kt. The first median averages the two central values in an even-sized sample. Its extra decimal is an arithmetic result, not a claim of greater physical accuracy.
This is evidence of a difference between the retained and excluded samples. It does not identify why vectors are absent. The released table cannot separate instrumental capability, observing geometry, reporting decisions or other possible causes. It also cannot establish that the same percentages apply to fireballs outside this catalog.
Annual bars need a reporting denominator
The all-record series ranges from 30 events in 2017 to 45 in 2015. Requiring vectors changes both numbers and their relative spacing: 2015 retains 22 of 45 records, or 48.9%, while 2024 retains 22 of 32, or 68.8%. Those years yield the same vector count despite different starting counts.
The CNEOS data page describes records released from U.S. Government sensor detections. It warns that the list is incomplete, releases are not real-time, and parameters can be revised. CNEOS does not independently reanalyze each event. Those limits matter before interpreting an annual count as a change in the actual rate of atmospheric entries.
Two separate selections are involved: which events enter the public catalog at all, then which catalog rows survive an analyst’s field requirements. This audit measures the second selection. It supplies no correction factor for the first.
Reproduce the field-availability audit
The bounded source query returns API version 1.2 and 405 rows in the retained snapshot. We checked the declared row count, unique timestamps, date bounds and the correspondence between field names and values. Missing values remain empty cells in our CSV; no missing location becomes a coordinate of zero.
For each row, location is present only when latitude, longitude and both direction indicators are populated. A vector is present only when all three components are populated. We independently test altitude, then take the intersection for the final table row. Summing each flag gives the retained counts; dividing by 405 gives the overall shares.
For the energy comparison, we use the supplied calculated-impact-energy field rather than converting the optical radiated-energy field. The source introduction describes the empirical relationship behind that estimate. The downloadable records preserve both quantities in their own units, so the selection can be repeated without confusing energy definitions.
The supplied annual, energy-bin and group-summary CSVs make every chart value checkable. This is a fixed historical snapshot. A later retrieval can differ if the catalog adds or revises records.
Keep the excluded records visible
For a geographic overview, report the 398 mapped records and the seven without coordinates. For a study using entry vectors, report the 244 retained records and the 161 excluded records, then inspect their energy and year distributions. If altitude is required too, the correct retained count becomes 243.
This practice makes the selection visible to the reader. It is especially useful when comparing a fireball catalog with another sensor’s detections or assessing possible explanations for a bright atmospheric signal. Agreement on a date or location does not by itself establish a matching event; the source-linked evidence brief provides a way to keep those comparisons explicit.
Sources and data
Source data: NASA/JPL CNEOS, public U.S. Government sensor reports, retrieved on 6 October 2026. Analysis, chart and explanatory text: LaunchDetect. This article was prepared with AI assistance. NASA has not reviewed this analysis and is not responsible for its accuracy.
- CNEOS fireball data and reporting limitations
- Fireball Data API fields and query documentation
- Fireball introduction and energy definitions
- JPL API fair-use policy
- NASA content-use guidance
Download all 405 records and availability flags (CSV) · Download annual counts (CSV) · Download energy-bin counts (CSV) · Download selection summaries (CSV)