Launch Watch · Launch Watch · Evidence study
Published
EPIC’s April 2024 archive: 418 records across 412 times
A month of NASA EPIC metadata reveals paired version records, changing image intervals and a 25-hour gap. Reproduce the audit with all 30 daily queries.
NASA EPIC’s natural-color archive returns 418 records for April 2024, spread across 412 distinct values of its image date field. The difference comes from six times that each have two records with different version values. Across the month, the spacing also changes: many days have roughly 108-minute intervals, the April 8 sequence has 30-minute intervals, and the last six days typically have roughly 65-minute intervals.
Those details matter if you are building an Earth animation or checking whether this archive samples a particular event. A daily image count alone misses both repeated times and long spaces between observations. This audit preserves every returned record, then builds a separate time axis from distinct timestamps.
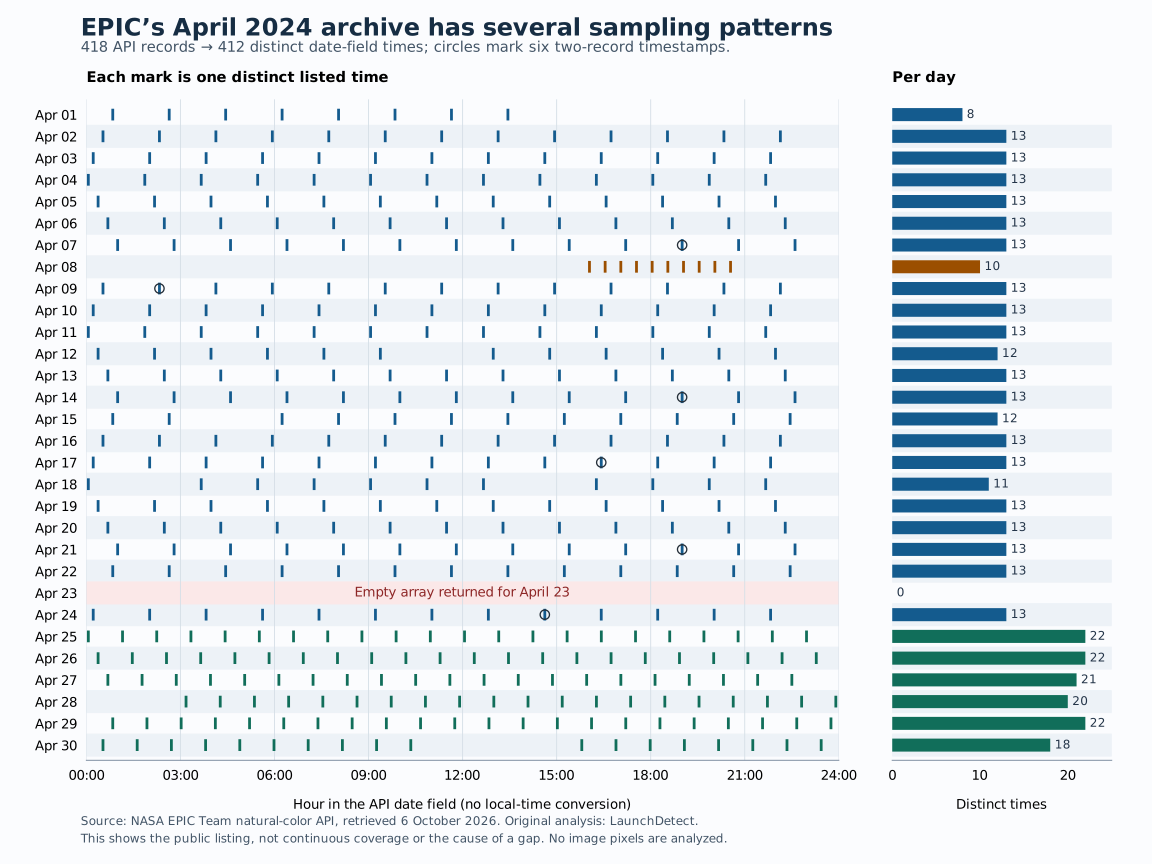
Open full-size sampling chart · Download PNG chart
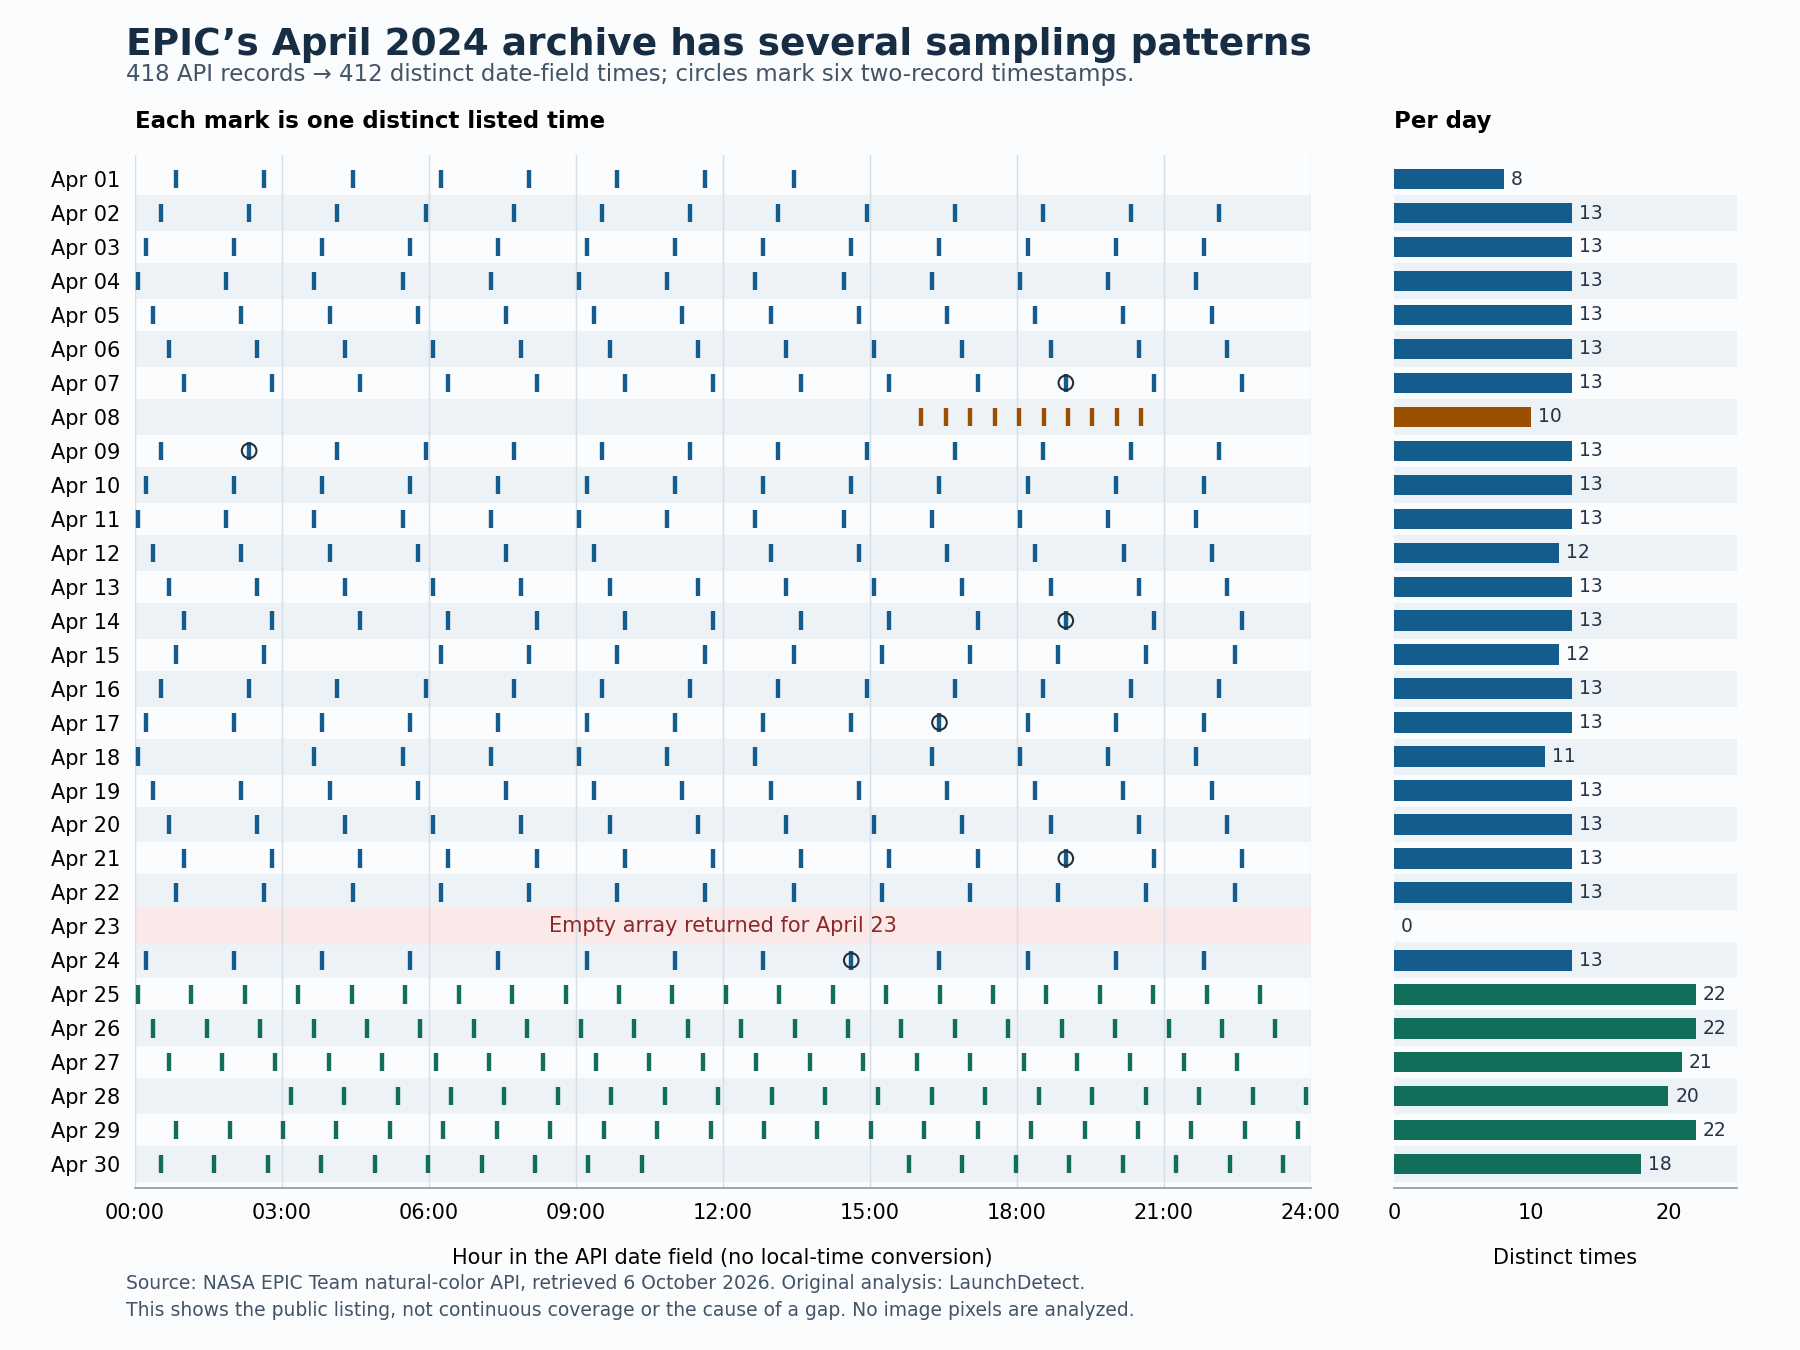
Start with the collection and the field
The NASA EPIC API documentation describes date-specific endpoints for several collections. We requested the natural-color collection for every date from April 1 through April 30, 2024. The response includes an image filename, a date field and other metadata. We use the date field for intervals, keeping its clock exactly as supplied rather than deriving time from the filename or converting it to local time.
This is an audit of the public natural-color listing as it existed at retrieval. It is not a reconstruction of all instrument exposures. NASA’s imagery explanation also records that earlier reprocessing changed filenames, timestamps and available imagery. Saving the actual responses makes the calculation reproducible even if the listing changes later.
Six paired records add no new timestamp
The 418 records have 418 different image names and identifiers. However, six date-field values each appear twice. Each of those pairs contains a version “03” record and a version “04” record. That produces 418 − 6 = 412 distinct times.
For example, the April 7 response contains both image names below at 19:00:12. The filenames differ, so this analysis does not discard either record or claim that their pixels are identical.
| Date field | Image name | Version |
|---|---|---|
| 2024-04-07 19:00:12 | epic_1b_20240407190434 | 03 |
| 2024-04-07 19:00:12 | epic_1b_20240407190500 | 04 |
The other paired times occur on April 9, 14, 17, 21 and 24. Collapsing them only for the time-axis calculation avoids adding six zero-length intervals. Choosing which image version to display is a separate decision that would require inspecting the images and their processing context.
One month contains several spacing patterns
Most nonempty days before April 25 have a median within-day interval of 108 minutes 2 seconds after repeated times are collapsed. April 8 is an exception: its ten distinct times run from 16:02:50 to 20:32:50, with nine intervals of exactly 30 minutes. Ten regularly spaced frames therefore span 4 hours 30 minutes, rather than covering that entire calendar day.
On April 25, the within-day median falls to 65 minutes 27 seconds and remains at that value through April 30. The last six daily counts range from 18 to 22. We can measure this change in the returned listing without assigning an operational cause to it.
| Date | API records | Distinct times | Median interval within day | Largest interval within day |
|---|---|---|---|---|
| April 1 | 8 | 8 | 108 min 2 sec | 108 min 3 sec |
| April 7 | 14 | 13 | 108 min 2 sec | 108 min 3 sec |
| April 8 | 10 | 10 | 30 min | 30 min |
| April 18 | 11 | 11 | 108 min 2 sec | 216 min 5 sec |
| April 23 | 0 | 0 | None | None |
| April 24 | 14 | 13 | 108 min 2 sec | 108 min 3 sec |
| April 25 | 22 | 22 | 65 min 27 sec | 65 min 28 sec |
| April 30 | 18 | 18 | 65 min 27 sec | 327 min 16 sec |
A median describes typical spacing but can hide a substantial interruption. April 30 still has a 65-minute-27-second median despite a 5-hour-27-minute-16-second interval from 10:20:52 to 15:48:08. For event sampling, the intervals near the event matter more than the month’s average or a nominal daily rate.
Keep the gap that crosses midnight
The April 23 query succeeded with an HTTP 200 response containing an empty array. Across the combined, sorted month, the longest interval runs from April 22 at 22:26:55 to April 24 at 00:13:03: 92,768 seconds, or 25 hours 46 minutes 8 seconds.
Calculating intervals separately inside each day would lose that result. It would also miss the 17-hour-26-minute-34-second interval from the last April 7 time to the first April 8 time. Both endpoints must stay on one continuous calendar axis, even when an animation or API request is organized into days.
The empty result establishes what this endpoint returned. It does not establish that EPIC took no observations on April 23, that the spacecraft failed, or that a particular weather event was absent. These responses contain no explanation of the gap. A cause would require additional operational or processing records.
What this changes in an Earth animation
NASA describes its website player as a slideshow animation. If you build your own player with one equal playback step per listed image, the duration represented by a step will vary. Using the typical intervals here, a 108-minute-2-second step represents about 1.65 times as much elapsed time as a 65-minute-27-second step. At a repeated timestamp it represents no advance in the date field.
A useful player can display the source time for every frame, expose the elapsed interval to the next frame, and visibly flag longer gaps. If you choose constant playback speed, explain that choice. If you interpolate intermediate pictures, label them as interpolation rather than additional observations. Neither playback option can create missing evidence.
How to reproduce the audit
- Request the natural-color date endpoint for all 30 days, including April 23. Preserve each response and its retrieval date; treat a failed request differently from a successful empty response.
- Keep each record’s date field, image name, identifier and version. Check that each date field belongs to the requested day. The downloaded record CSV retains all 418 rows.
- Group records by identical date-field values for the sampling calculation. Preserve the versioned rows separately. Count each group once on the chart.
- Sort all 412 distinct times together and subtract each time from the following one. This produces 411 positive intervals, including intervals across calendar dates. Separately calculate within-day intervals for the daily summary.
- Check the April 8 sequence, the six paired timestamps, and the empty April 23 response against their original endpoints. The downloadable CSVs expose both the record inventory and the interval calculations.
The analysis includes no timestamps outside April. Its longest interval is the longest between consecutive listed times within this selected month; it does not measure a gap before the first record or after the last. It analyzes no image pixels, does not assess cloud visibility, and does not measure instrument exposure duration or event-detection probability.
The practical result is a version-aware, timestamp-based view of one month’s public archive. Before using an EPIC sequence as evidence of change, check which times it actually represents and show readers where the time axis has gaps. For a different issue within EPIC images, the Moon color-edge study examines how sequential color exposures affect a single assembled frame.
Sources and data
Source responses and documentation were retrieved on 6 October 2026. Data and source material: NASA EPIC Team. Analysis and chart: LaunchDetect. No NASA image pixels or logos are reproduced.
AI-assisted analysis by LaunchDetect. NASA has not reviewed this analysis and is not responsible for its accuracy.
- NASA EPIC API documentation
- NASA EPIC imagery explanation and image-use policy
- NASA EPIC website and slideshow documentation
- Download all 418 returned records, with the source URL for every row (CSV)
- Download all 30 daily summaries and source URLs, including the empty day (CSV)
- Download all 411 distinct-time intervals (CSV)