Launch Watch · Evidence study
Published
Falcon Heavy in GOES imagery: two products and two clocks
Inspect NOAA’s 2019 Falcon Heavy imagery: separate the water-vapor still from the visible sequence and acquisition labels from GIF playback.
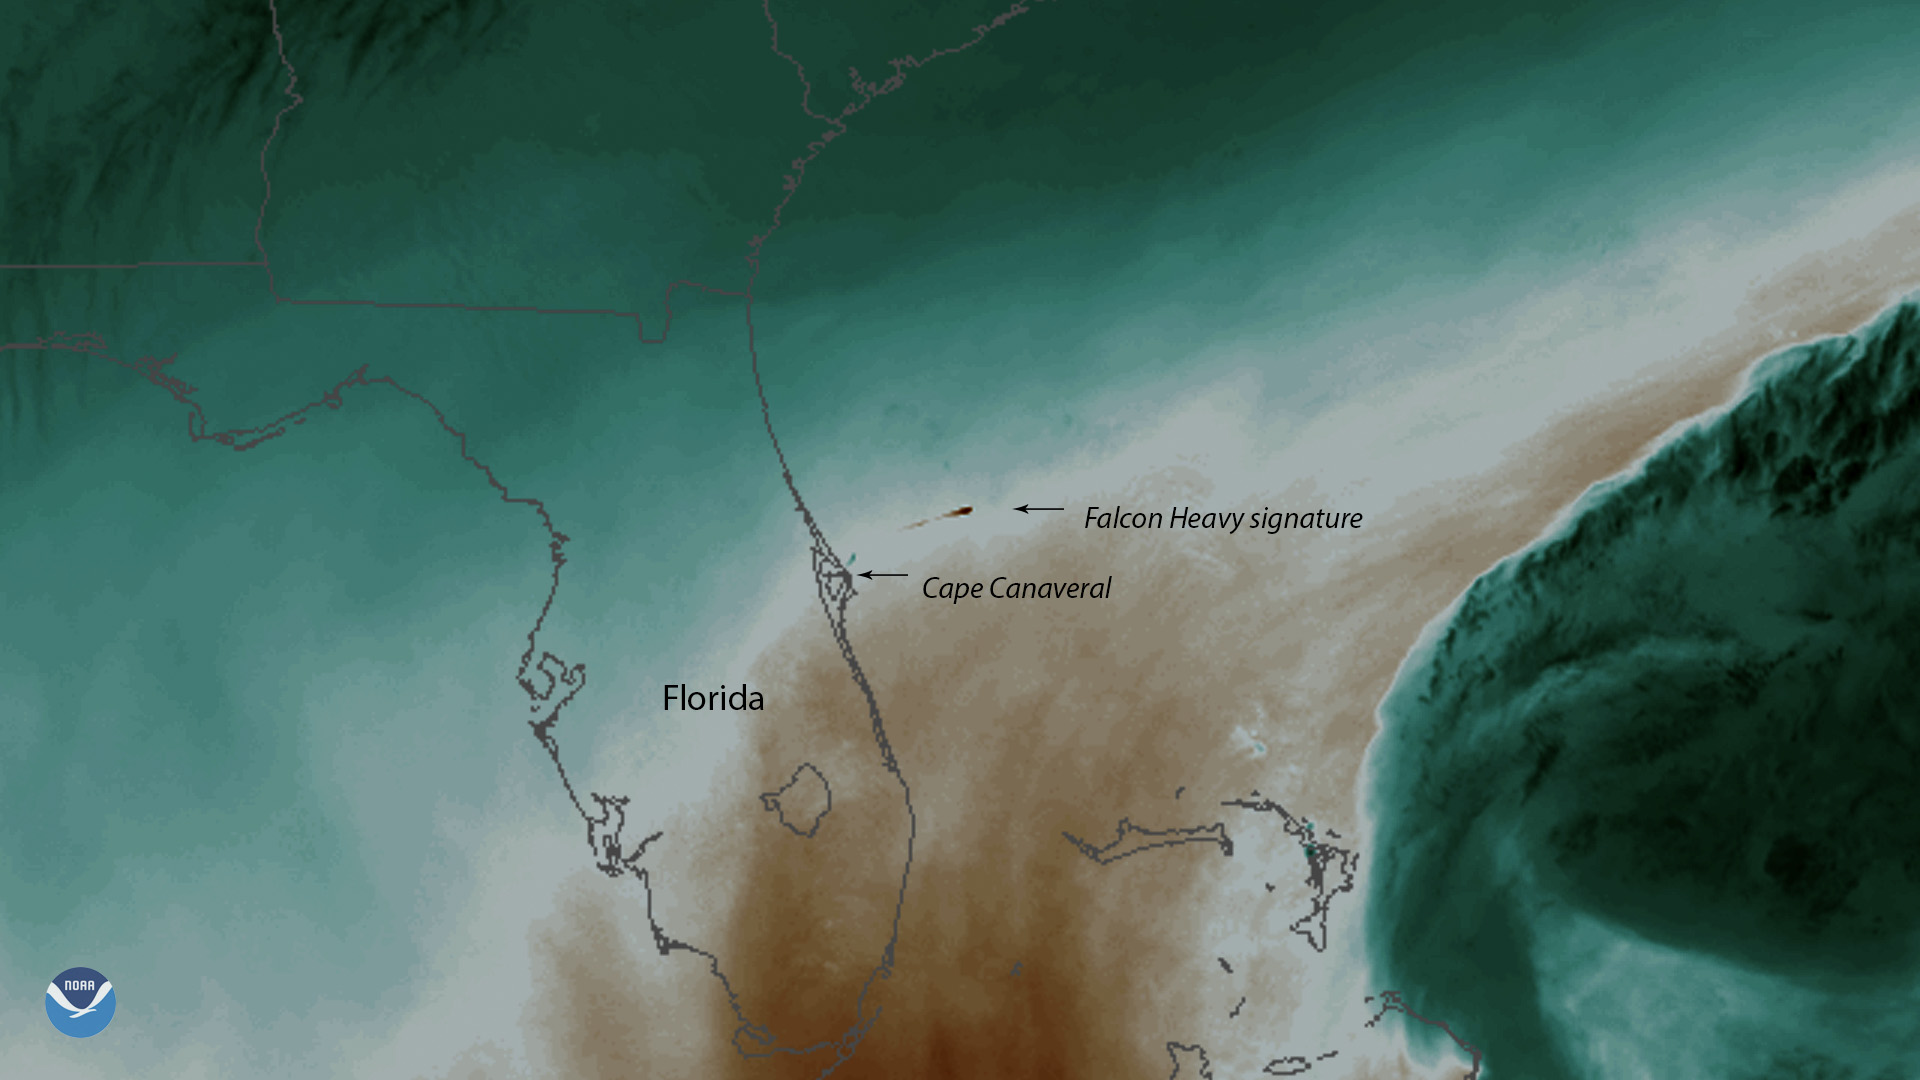
NOAA’s April 2019 Falcon Heavy page puts a water-vapor still beside a short launch animation. They belong to the same launch story, but the page does not make them one measurement. The still has a Band 8 interpretation; the animation is a separate file with its own image labels and playback timing.
We inspected the still and all four animation frames, then read the GIF’s encoded delays. The four displayed times are five minutes apart. The file holds those frames for 2.5, 0.5, 0.5 and 1 second. That difference is enough to rule out using the animation’s apparent speed as a rocket-speed measurement.
Separate the still from the sequence
NOAA’s report describes the launch of Arabsat-6A and says the water-vapor band likely registered a localized warm-air feature after the rocket passed. “Likely” is important: that is the provider’s interpretation of the signature, not a calibrated plume-temperature measurement made here.
The animation’s filename ends in vis.gif, and each retained frame has a footer marked G-16 IMG 2. Those visible-sequence identifiers should be kept with the animation rather than overwritten with the page’s Band 8 narrative. We did not retrieve its underlying calibrated product metadata, so the footer is recorded as displayed rather than treated as a complete raw-data channel specification.
NOAA’s Band 2 guide describes a 0.64-micrometer visible band; its Band 8 guide describes the 6.2-micrometer upper-level water-vapor infrared band. The two have different observing roles. A bright feature in one cannot be assigned the physical meaning of a color in the other simply because both depict the launch region.
The observation ledger exposes the timing
| Frame | Displayed date | Displayed clock | Minutes after first label | Encoded hold (ms) |
|---|---|---|---|---|
| 1 | 2019-04-11 | 22:31:17 | 0 | 2500 |
| 2 | 2019-04-11 | 22:36:17 | 5 | 500 |
| 3 | 2019-04-11 | 22:41:17 | 10 | 500 |
| 4 | 2019-04-11 | 22:46:17 | 15 | 1000 |
The footer clock strings are transcribed as hours, minutes and seconds. We preserve the displayed clock rather than adding a time-zone label that is not printed in the retained frames. Each step is 300 seconds, and the first-to-last span is 900 seconds, or 15 minutes.
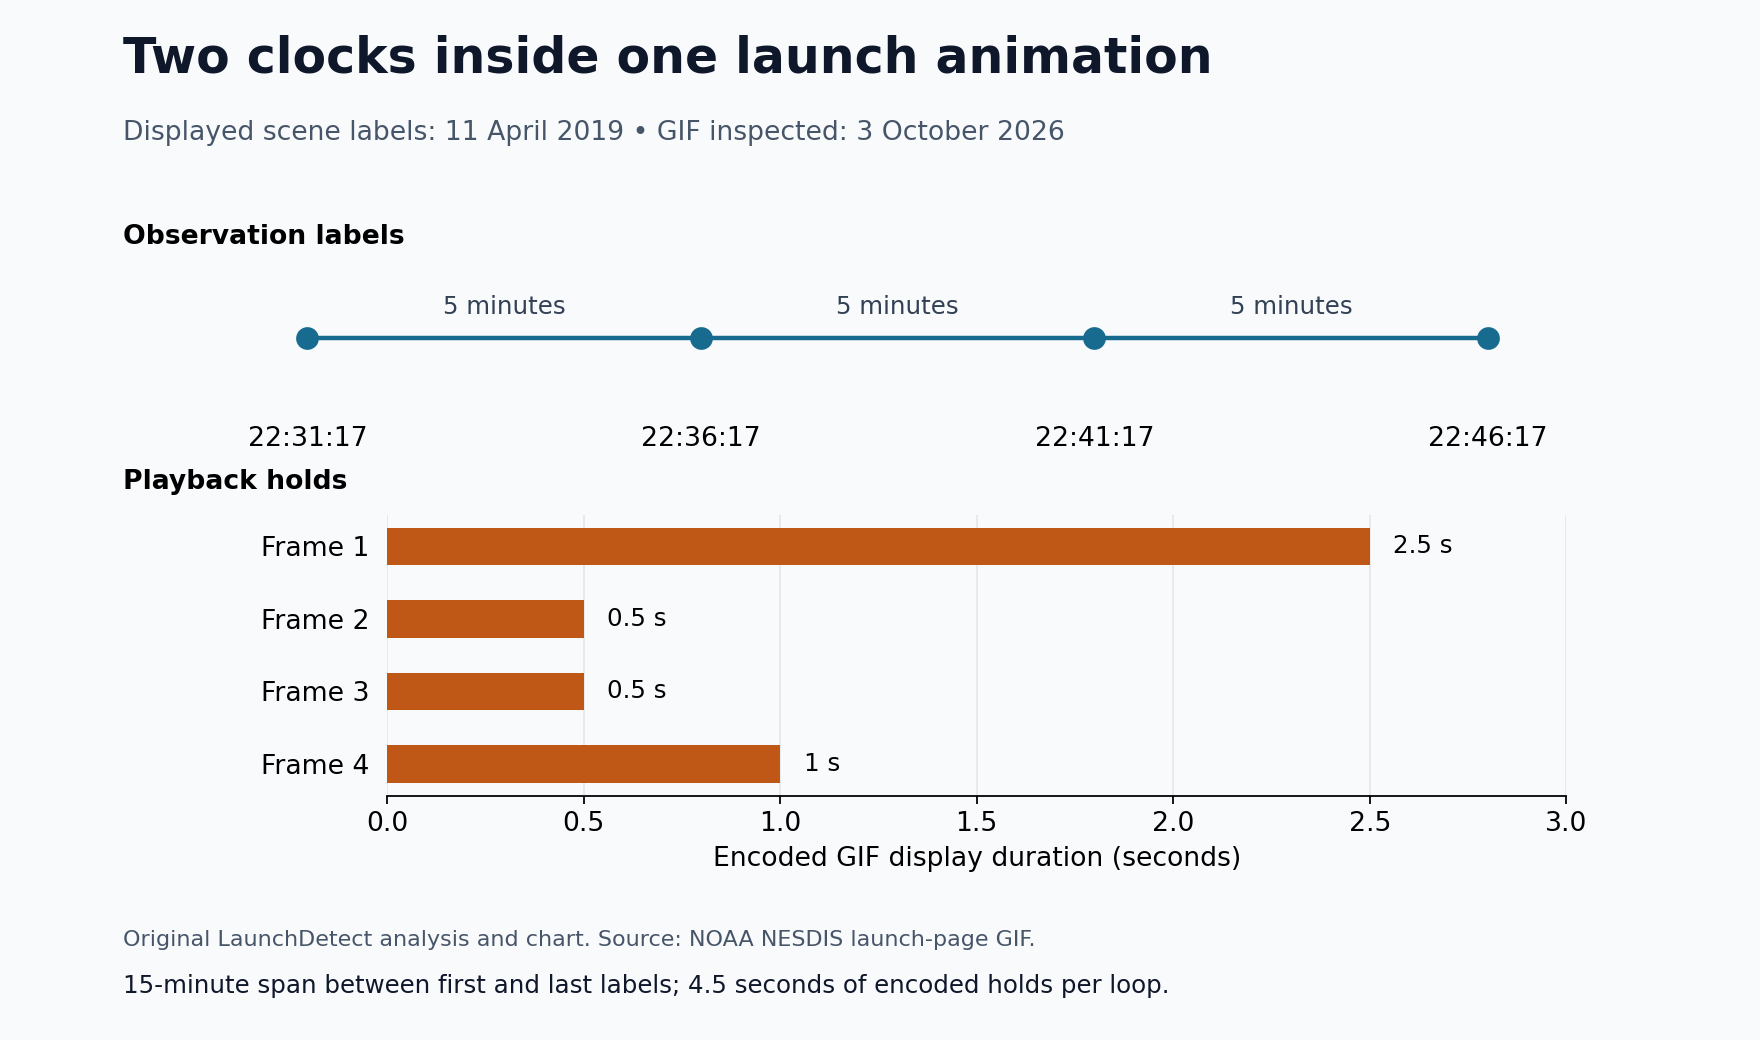
The first frame is held five times as long as either middle frame. A viewer sees a long pause followed by two quicker changes even though the displayed observation times advance evenly. At the end, the animation returns to an earlier frame: the loop boundary is a playback reset, not a later observation.
Check what the GIF duration does and does not measure
A GIF frame delay tells a player how long to display the frame. It does not tell you how long the satellite exposure lasted. These four delays total 4,500 milliseconds. Browser rendering can add its own timing behavior, so the file’s encoded holds are the reproducible quantity we report.
The animation is also a selected four-frame sequence. Five-minute gaps between these labels do not prove that all native scans were five minutes apart or that no intermediate observation exists. Download the four-row timing ledger.
Why no speed or temperature follows from this page
A motion estimate would first need a clearly identified feature in each observation, geographic positions with known uncertainties, consistent observation times and a physical reason to interpret that feature’s displacement as the motion of interest. A visible trail can change shape while the vehicle is elsewhere. The imagery shown here does not supply that full measurement chain.
A temperature estimate has a different missing chain: calibrated radiances, band-specific interpretation and the relevant retrieval assumptions. The annotated still provides no numeric temperature legend, and we have not acquired the calibrated scene. Sampling the JPEG’s display colors would measure the rendering, not establish exhaust temperature.
A reusable way to read launch imagery
Start a separate ledger for each asset: source, instrument or channel label, date, displayed observation time, processing level and playback behavior. Keep provider interpretation in its own field. Then ask what evidence would be needed for the measurement you actually want.
For this case, the reliable result is a documented product distinction and a measured playback mismatch: four equally spaced observation labels, four unequal display holds. That is already useful. It prevents an engaging animation from quietly becoming a speedometer.