Launch Watch · Launch Watch · Evidence study
Published
A dark forest can be brighter than desert in near infrared
MODIS surface reflectance reverses the forest–desert ordering between red and near infrared in two screened July 2023 windows. The observation dates also differ.
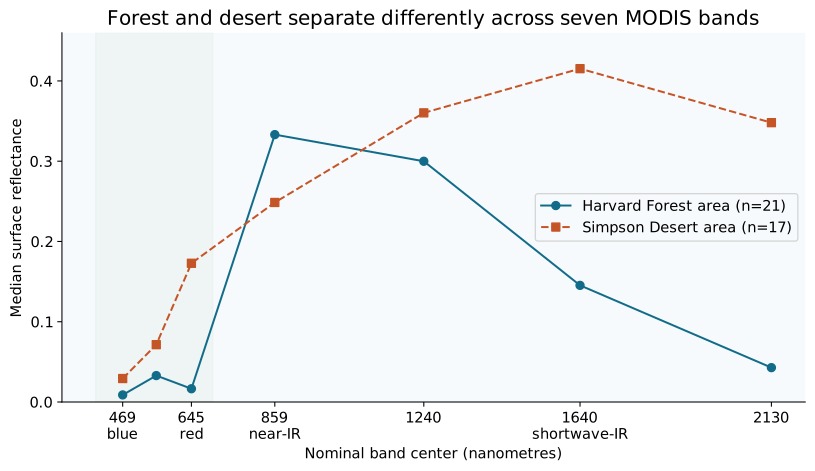
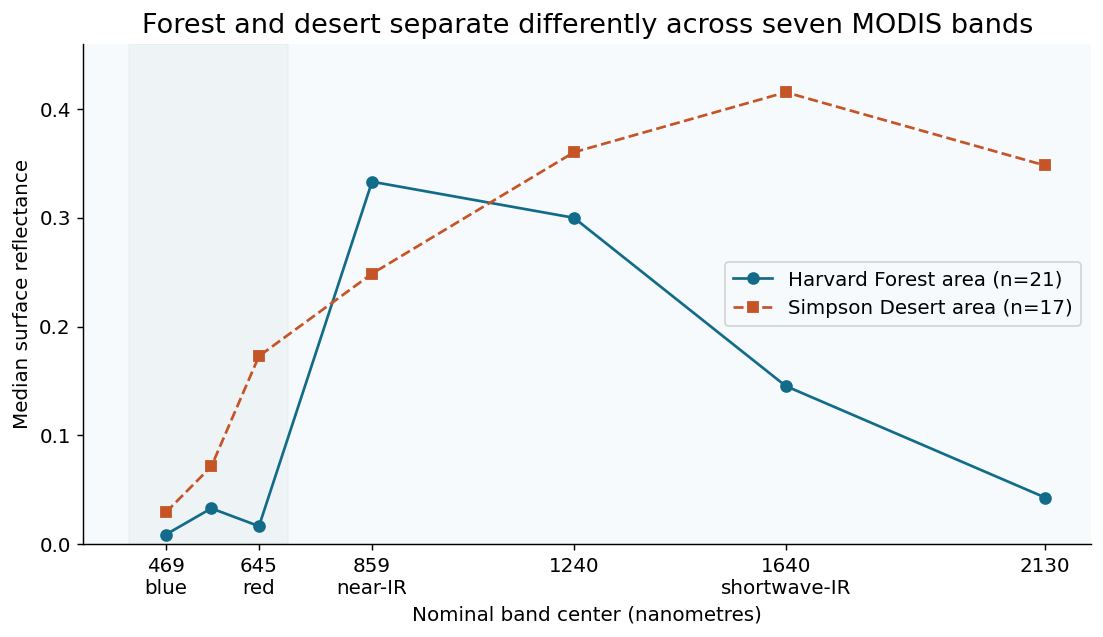
In visible red, the sampled forest is much darker than the sampled desert: median surface reflectance is 0.0165 near Harvard Forest and 0.1728 in the Simpson Desert window. In near infrared, the ordering reverses, with the forest at 0.3331 and the desert at 0.2486.
“Brighter” therefore needs a wavelength attached. These two MODIS windows provide a worked seven-band comparison, with quality flags and per-pixel observation dates retained rather than relying on how a color image looks.
Open full-size figure · Download PNG figure
Read across the bands, not just across the landscape
The MOD09A1 Collection 6.1 product supplies atmospherically corrected surface reflectance in broad spectral bands. The graph orders them by wavelength, rather than by numerical band identifier.
Band 1, centered near 645 nanometres, is the visible-red comparison. Band 2, near 858.5 nanometres, supplies the near-infrared reversal. At band 6, near 1,640 nanometres, the desert median is again larger: 0.4153 versus 0.1453 for the forest window.
| MODIS band | Center (nm) | Forest median (21 pixels) | Desert median (17 pixels) |
|---|---|---|---|
| 3 | 469.0 | 0.0088 | 0.0292 |
| 4 | 555.0 | 0.0329 | 0.0714 |
| 1 | 645.0 | 0.0165 | 0.1728 |
| 2 | 858.5 | 0.3331 | 0.2486 |
| 5 | 1240.0 | 0.2999 | 0.3602 |
| 6 | 1640.0 | 0.1453 | 0.4153 |
| 7 | 2130.0 | 0.0428 | 0.3480 |
The connecting lines help the eye follow the broad bands. They are not a measured continuous hyperspectral spectrum. Likewise, surface reflectance should not be described as a thermal temperature, raw sensor brightness or a BRDF-normalized measurement.
Keep the quality-screened sample visible
Each request returns a five-by-five-cell window. The declared strict screen retains 21 of 25 pixels near Harvard Forest and 17 of 25 in the Simpson Desert. The band medians at a given site use the same accepted pixels, keeping the spectral comparison internally consistent.
The forest-area window is centered at 42.5378° N, 72.1715° W; the desert window at 24.5° S, 137.3° E. Both use the A2023193 eight-day product label and a one-kilometre half-width and half-height. Returned grid spacing is 463.312716528 metres.
These are two small landscapes in different seasonal settings, not a controlled experiment or a universal forest-and-desert spectral library. The finding should stay attached to these windows and this composite.
The shared product date does not make the observations simultaneous
All retained forest pixels select day 193, 12 July 2023. The retained desert pixels select day 195, 14 July. An eight-day composite label identifies the product interval; it does not require every admitted observation to come from the same day.
The CSV preserves the selected observation day for each pixel. That field is essential if the comparison is extended to a short-lived event or a question that needs simultaneous acquisition. The two-day difference is visible provenance, not a detail to erase for a cleaner chart.
Scaling, screening and the NDVI calculation
We reject raw reflectance outside −100 to 16,000, require MODLAND quality bits 0–1 equal to zero and require all seven per-band quality nibbles equal to zero. The state screen excludes the specified cloud, shadow, cirrus, internal-cloud, adjacent-cloud and high-aerosol conditions.
All seven reflectance fields are multiplied by 0.0001 before summarizing. NDVI is calculated for each retained pixel as near-infrared minus red reflectance, divided by their sum. Only then do we take the median of the per-pixel indices.
The resulting median NDVI is 0.903460 for the forest window and 0.179877 for the desert window. Taking an index of the two band medians would be a different aggregation and is not the operation used here. NDVI itself is an index, not a species identification or a biomass measurement.
A precise way to describe the reversal
The supported statement is that these screened July 2023 windows have lower forest reflectance in red but higher forest reflectance in near infrared. It does not imply that every forest is brighter than every desert in that band.
For another comparison, keep the same four items beside the graph: band definitions, product type, admitted pixels and actual observation dates. They explain what the contrast means and make it possible to reproduce without confusing visible appearance with the rest of the spectrum.
Sources and data
Source snapshots were retrieved on 6 October 2026. The observation dates and product versions are stated above; retrieval does not make a historical record current.
- NASA MOD09A1 Harvard Forest-area subset (Collection 6.1; A2023193)
- NASA MOD09A1 Simpson Desert-area subset (Collection 6.1; A2023193)
- MODIS Surface Reflectance User Guide (Collection 6.1, v1.7)
- NASA MOD09A1 catalog (Collection 6.1; bands, wavelengths, units and QA)
- NASA MODIS Simpson Desert context (2023-07-16 report; Terra image acquired 2023-07-14; no image reused)
Dataset credits
- E. Vermote. 2021. MOD09A1 MODIS/Terra Surface Reflectance 8-Day L3 Global 500m SIN Grid V061. NASA EOSDIS Land Processes DAAC. https://doi.org/10.5067/MODIS/MOD09A1.061
- ORNL DAAC. 2018. Terrestrial Ecology Subsetting & Visualization Services (TESViS) RESTful Web Service. ORNL DAAC. https://doi.org/10.3334/ORNLDAAC/1600
Download B457-spectral-medians.csv (CSV) · Download B457-spectral-pixels.csv (CSV)