Launch Watch · Launch Watch · Evidence study
Published
One-kilometre GEDI cells can hide sixfold differences in laser sampling
A GEDI Central Redwoods window has 49–299 valid laser footprints per 1 km cell. Equal grid size hides unequal sampling and changes how means should be read.
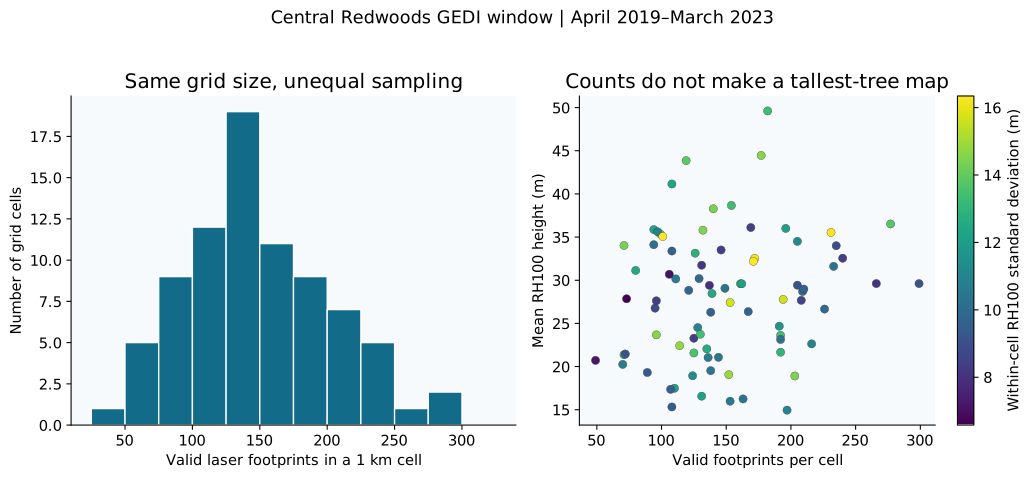
Two grid cells can both be labeled “one kilometre” while containing very different amounts of laser sampling. In a nine-by-nine-cell GEDI window around the Central Redwoods fixed site, valid footprint counts range from 49 to 299 per cell, a 6.10-fold difference.
The 81 cells contain 12,095 retained laser footprints in total. Their equal nominal size does not make their sampling identical, and a cell’s mean height metric is not a measurement of its tallest tree.
Open full-size figure · Download PNG figure
Read the count beside the height
The GEDI L3 Version 2 product supplies gridded summaries of retained laser-footprint metrics. This example uses RH100 mean and standard deviation together with the valid-footprint count. Keeping all three avoids presenting a mean as though every cell had the same supporting sample.
Cell mean RH100 ranges from 14.9527 to 49.6110 metres in the selected window. RH100 is a footprint height metric, and the gridded value averages such metrics. It should not be relabeled “tallest individual tree in this square kilometre.”
| Summary | Value | What it describes |
|---|---|---|
| Valid cells | 81 | Nine-by-nine grid, nominal 1 km cells |
| Valid laser footprints | 12,095 | Total retained footprints across the window |
| Footprints per cell | 49–299 | 6.10-fold range in sampling count |
| Cell mean RH100 range | 14.9527–49.6110 m | Range of footprint-metric means |
| Equal-cell mean RH100 | 28.093772 m | Each cell mean receives equal weight |
| Count-weighted mean RH100 | 28.480247 m | Each cell mean weighted by its footprint count |
| Median within-cell RH100 SD | 10.8975 m | Variation among retained footprint heights |
Two averages, two weighting choices
Averaging the 81 cell means equally gives 28.093772 metres. Weighting those same means by the number of retained footprints in each cell gives 28.480247 metres. The difference is a reminder to state the weighting rule when reporting a regional summary.
The count-weighted result gives more influence to cells with more footprints. It is not an area-weighted estimate. Although the grid cells share a nominal size, their laser observations occur along instrument tracks and pass through quality filtering. More observations do not automatically guarantee more representative spatial coverage.
Neither weighting scheme repairs a biased sample simply by changing the arithmetic. Choosing between them depends on the quantity being summarized and how the sampling design relates to that quantity.
Variation is not the uncertainty of the mean
The median within-cell RH100 standard deviation is 10.8975 metres. That describes variation among retained footprint heights within cells. In the chart, color represents this within-cell variability.
It is not the standard error of a cell mean or a confidence score. Dividing a standard deviation by the square root of the count without checking independence and sampling assumptions would attach an unjustified uncertainty interpretation. The along-track sampling makes those assumptions especially important to inspect.
The date is an accumulation endpoint
The official TESViS fixed-site identifier is us_california_central_redwoods, centered at 38.632272° N, 123.301511° W. We request GEDI03 A2023081 and retain the returned nine-by-nine neighborhood.
The filenames encode the interval 2019108–2023081, release 002 and production version 05. That spans 18 April 2019 through 22 March 2023. The request’s March 2023 date is therefore the end of an accumulation period, not a one-day canopy snapshot.
We retain all five supplied variables and reject cells with zero counts or −9999 height or standard-deviation values. All 81 cells pass those criteria. The public cell CSV supports both mean calculations: sum the cell means and divide by 81, or sum count times mean and divide by the total count.
Pin the version before extending the example
This analysis uses GEDI L3 Version 2 as served by TESViS. A newer Version 3 also exists; these values are not presented as the newest available GEDI product. Comparing versions would require checking their changed inputs and processing.
The documentation endpoint retained for supporting methods returns an older release 1.0 document, so the Version 2 catalog, service metadata and filenames anchor this dataset’s identity. The window is also a neighborhood around one named site, not all redwoods or an entire forest park. These limits keep an informative sampling example from turning into an unsupported forest-wide inventory.
Sources and data
Source snapshots were retrieved on 6 October 2026. The observation dates and product versions are stated above; retrieval does not make a historical record current.
- NASA GEDI L3 Central Redwoods fixed-site subset (GEDI03 Version 2; 2019108–2023081; release 002, production 05)
- TESViS available GEDI fixed-site accumulation endpoints (Retrieved current available endpoints)
- TESViS GEDI variable definitions (Counts, RH100 mean and standard deviation in metres)
- NASA ORNL DAAC GEDI L3 dataset catalog (Dubayah et al. 2021, Version 2, DOI 10.3334/ORNLDAAC/1952)
- GEDI L3 algorithm theoretical basis document returned by guide endpoint (Release 1.0, March 4, 2021; archived supporting methods)
- TESViS product versions and citations (GEDI03 Version 2 declared by service)
Dataset credits
- Dubayah, R.O., S.B. Luthcke, T.J. Sabaka, J.B. Nicholas, S. Preaux, and M.A. Hofton. 2021. GEDI L3 Gridded Land Surface Metrics, Version 2. ORNL DAAC, Oak Ridge, Tennessee, USA. https://doi.org/10.3334/ORNLDAAC/1952
- ORNL DAAC. 2018. Terrestrial Ecology Subsetting & Visualization Services (TESViS) RESTful Web Service. ORNL DAAC. https://doi.org/10.3334/ORNLDAAC/1600