Launch Watch · Current evidence
Published
GLODAP’s 1,181 cruise rows: the uncertainty that averaging keeps
Audit GLODAPv3’s cruise uncertainty file and see why a shared 2.1 µmol/kg component cannot be divided by the square root of a bottle count.
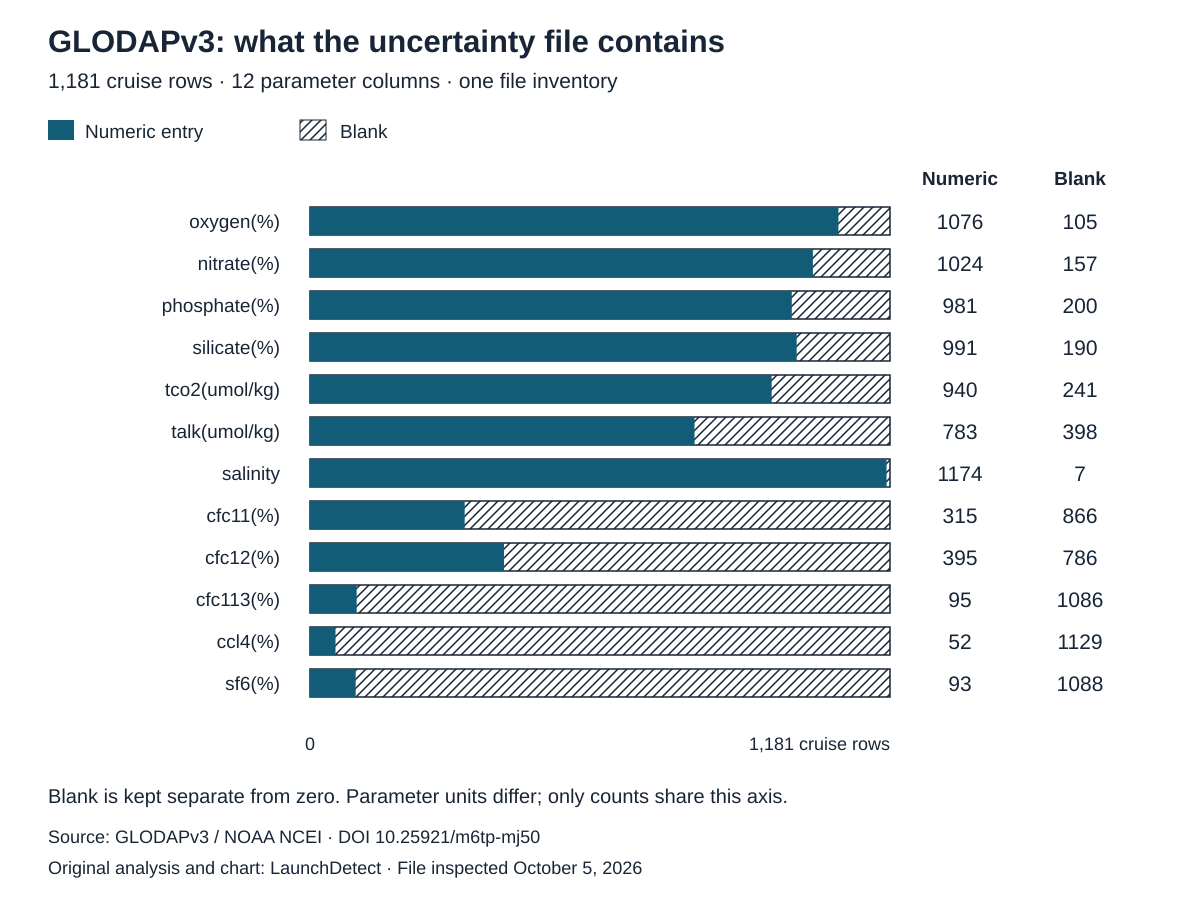
More samples from one ocean cruise do not automatically reduce an uncertainty that all those samples share. GLODAPv3 makes that issue explicit in a cruise-level uncertainty file. Our audit of its 1,181 rows finds 940 numeric entries for dissolved inorganic carbon and 241 blanks, followed by a practical example of the mistake that a routine square-root-of-sample-count calculation can introduce.
The timely prompt is NOAA’s October 5 feature on ocean-carbon data. It looks back at SOCAT’s June release and GLODAP’s July release. The observations and products were not first collected or released on October 5. SOCAT’s roughly 44 million surface-ocean observations and GLODAP’s cruise collection describe different products and counting units, so they should not be added together as one coverage total.
What is inside the cruise uncertainty file?
We downloaded the GLODAPv3 cruise-uncertainty CSV from NOAA NCEI and counted records using EXPOCODE, the cruise identifier. The file has 1,181 rows and 1,181 distinct EXPOCODE values. Excluding the identifier and region columns leaves 12 parameter columns. Our calculation inventories that file; it does not count individual bottle samples or estimate a global ocean-carbon trend.
| Source column | Numeric entries | Blank entries | Median of numeric entries |
|---|---|---|---|
| oxygen(%) | 1076 | 105 | 0.5 |
| nitrate(%) | 1024 | 157 | 1.0 |
| phosphate(%) | 981 | 200 | 1.1 |
| silicate(%) | 991 | 190 | 1.1 |
| tco2(umol/kg) | 940 | 241 | 2.2 |
| talk(umol/kg) | 783 | 398 | 2.2 |
| salinity | 1174 | 7 | 0.0027 |
| cfc11(%) | 315 | 866 | 5.0 |
| cfc12(%) | 395 | 786 | 5.0 |
| cfc113(%) | 95 | 1086 | 5.0 |
| ccl4(%) | 52 | 1129 | 5.0 |
| sf6(%) | 93 | 1088 | 10.0 |
The carbon column labeled tco2 is in micromoles per kilogram and refers to dissolved inorganic carbon. Its 940 numeric values have a median of 2.2 and range from 2.0 to 13.6 µmol/kg. Those are summaries of the cruise-uncertainty entries. They are not average carbon concentrations or the uncertainty of a global estimate.
The columns use different units: several are percentages, tco2 and talk use µmol/kg, and salinity is separate again. Comparing their raw numerical magnitudes would mix unlike quantities. The availability counts can share a chart because their unit is the same: cruise rows with a numeric entry.
Why the cruise identifier changes the calculation
The GLODAP data-access instructions describe these uncertainties as arising from practices that are consistent within a cruise and vary between cruises. To propagate them, the instructions call for a common perturbation affecting all measurements from the same cruise. In a simulation, that means one shared change for a cruise’s measurements, rather than a fresh independent change for every bottle.
The averaging consequence follows directly. If every value in a cruise receives the same additive change, their average receives that same change. Adding more values from that cruise does not average away this common component. Other measurement errors and other uncertainty sources can behave differently; this example addresses only the supplied cruise-level component.
A real entry, with an explicitly hypothetical sample count
The file gives EXPOCODE 06AQ19860627 a tco2 cruise uncertainty of 2.1 µmol/kg. We use that actual metadata value below. The sample counts are hypothetical; no count of that cruise’s observations is implied.
| Hypothetical samples averaged | Shared cruise component retained | Wrong result if treated as independent |
|---|---|---|
| 1 | 2.1 µmol/kg | 2.1 µmol/kg |
| 10 | 2.1 µmol/kg | 0.664 µmol/kg |
| 100 | 2.1 µmol/kg | 0.210 µmol/kg |
The final column divides 2.1 by the square root of the hypothetical sample count. That operation would apply to an appropriately independent component under suitable assumptions. Applied to this shared cruise component, it produces unjustified shrinkage: at 100 hypothetical samples, 0.21 is ten times smaller than 2.1. The middle column preserves the common change that GLODAP’s instructions describe.
This does not mean the total uncertainty of a 100-sample mean is 2.1 µmol/kg. We have not assembled that mean, its other uncertainty components, a probability distribution or cross-cruise relationships. The calculation isolates one dependency that an analysis needs to preserve.
A blank is a decision point
The 241 blank tco2 cells should remain distinct from numeric zero. Our audit found no numeric zeros in any of the 12 parameter columns, but that is a property of the downloaded file rather than a rule to impose on future versions. A blank uncertainty entry alone does not prove that a cruise had no relevant observations, and silently replacing it with zero would assert certainty that the cell does not provide.
A reproducible workflow should retain the original column names and units, join uncertainty metadata by EXPOCODE, preserve missingness flags, and make the chosen handling of incomplete rows visible. It should also preserve cruise grouping when propagating the shared component. Those choices determine whether the next calculation represents the supplied information faithfully.
Downloads and reproducibility
The 12-column audit CSV contains each parameter’s numeric count, blank count, zero count, minimum, median and maximum. The hypothetical-sample illustration CSV keeps the deliberately wrong independence calculation labeled. Both can be reproduced from the original NCEI file: count nonblank numeric cells separately by column, then calculate summaries only within that column.
Credit the GLODAP data team and underlying cruise providers when using the product, following the Data Use Statement linked from the download page and the GLODAPv3 data DOI. The methodology links on the inspected access page were labeled preprints. This article uses the published file and access instructions without describing those manuscripts as final peer-reviewed papers.
Dataset attribution: Lange, N., Lauvset, S. K., Carter, B. R., and colleagues (2026), The Global Ocean Data Analysis Project version 3 (GLODAPv3) – an internally consistent biogeochemical data product for the World Ocean, NCEI Accession 0315582, DOI 10.25921/m6tp-mj50. Subset used: cruise-uncertainty metadata; accessed October 5, 2026. Supporting manuscript: Lange and colleagues, GLODAPv3, described as submitted/preprint in the source guidance. Example cruise attribution: 06AQ19860627 data DOI. The dataset is CC BY 4.0; LaunchDetect added the aggregation, calculations and chart.