Launch Watch · Launch Watch · Evidence study
Published
More leaves, nearly the same absorbed-light fraction: MODIS at Harvard Forest
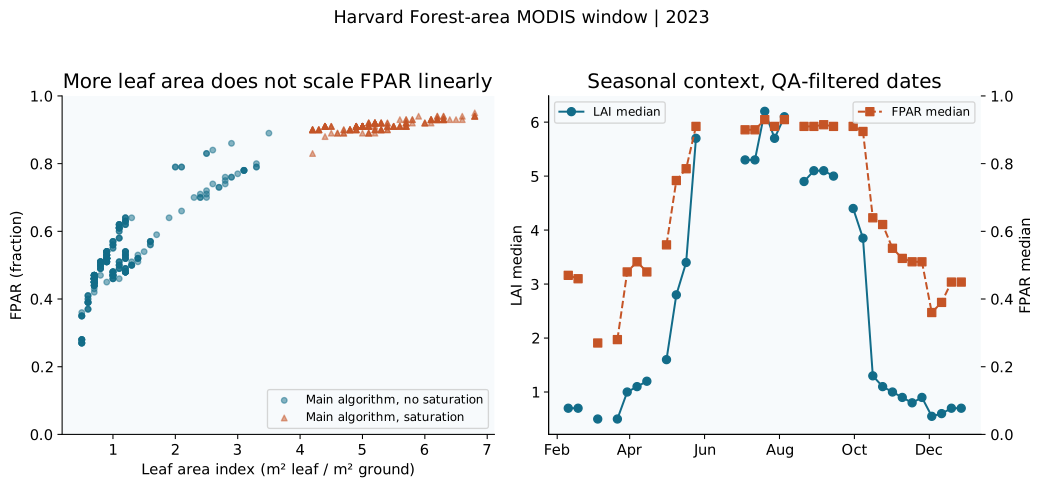
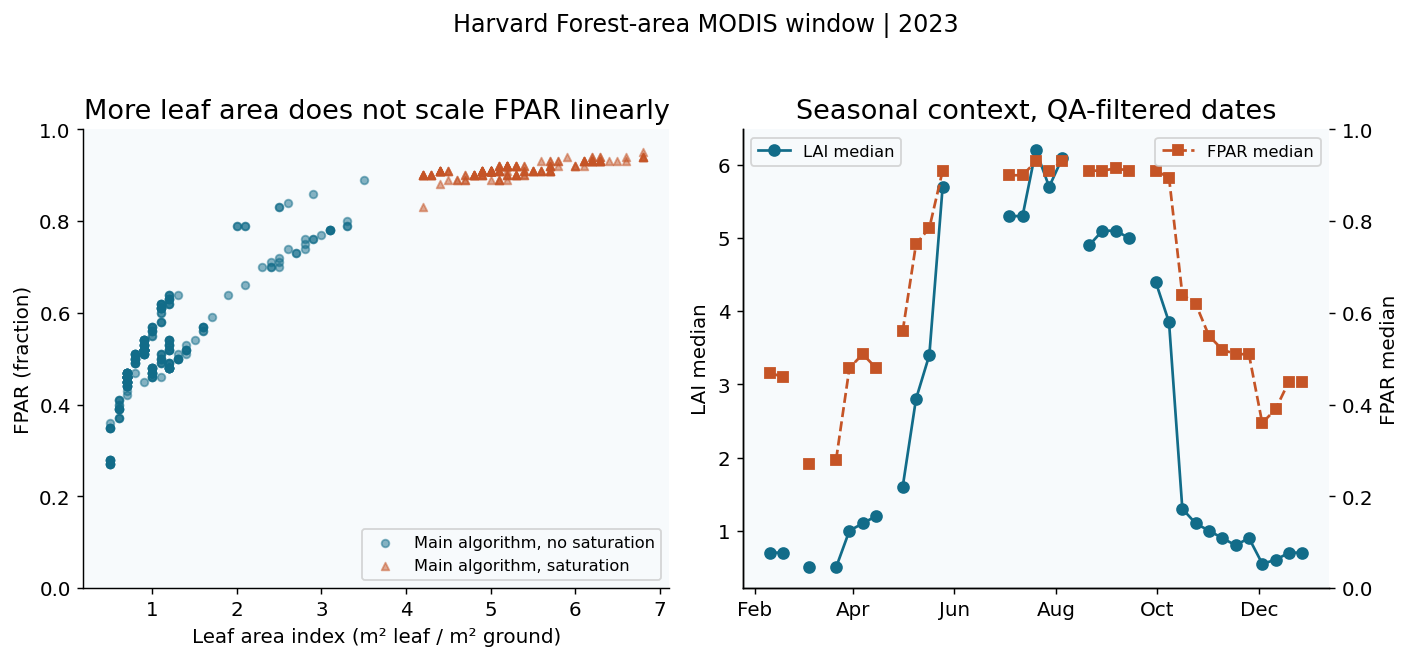
At Harvard Forest, 182 screened MODIS saturation-class observations span LAI 4.2–6.8 but FPAR 0.83–0.95. The quality flag matters to interpretation.
In a small MODIS window near Harvard Forest, higher leaf-area estimates cover a broad range while the absorbed-light fraction stays close to its upper end. Among 182 screened observations in the product’s saturation class, leaf area index spans 4.2–6.8, but FPAR spans only 0.83–0.95.
The quality label is central to reading that pattern. The MODIS guide describes this saturation class as a good, usable main-algorithm retrieval. Removing every result with “saturation” in its label would selectively discard this sample’s high-canopy observations.
Open full-size figure · Download PNG figure
Two quantities with different scales
Leaf area index, or LAI, expresses leaf area per unit ground area, in square metres of leaf per square metre of ground. FPAR is the fraction of photosynthetically active radiation absorbed by vegetation. A fraction is bounded in a way that LAI is not, so equal numerical changes in the two fields do not carry the same meaning.
The MCD15A2H Collection 6.1 product retrieves the two quantities together. Here, the saturation-class observations have median LAI 5.15 and median FPAR 0.91. The main-algorithm observations without saturation have medians of 0.90 and 0.51, respectively.
| Main-algorithm class | Observations | LAI median (range) | FPAR median (range) |
|---|---|---|---|
| Without saturation | 342 | 0.90 (0.5–3.5) | 0.51 (0.27–0.89) |
| With saturation | 182 | 5.15 (4.2–6.8) | 0.91 (0.83–0.95) |
What “saturation” means in this record
The saturation class concerns retrieval sensitivity. It does not mean the instrument is physically damaged, and it does not mean photosynthesis has stopped. The MODIS LAI/FPAR guide distinguishes a main-algorithm retrieval with saturation from other algorithm outcomes.
The scatter uses both class and marker shape to separate the two retained groups. It is a way to inspect the product’s behavior, not an independent validation: both axes come from a joint retrieval. Fitting a universal conversion from this small scatter would ignore that shared origin and the limited sampling.
Screen the observations before drawing the curve
The 2023 input contains 46 eight-day composites across a five-by-five-cell window, giving 1,150 pixel-composite observations. Our strict filter retains 524 observations across 32 composites: 342 without saturation and 182 with saturation.
Those are repeated observations of nearby pixels over time, not 524 independent experimental samples. Some composite dates have no observations left after filtering. The contextual median trace breaks at screened-out dates rather than interpolating a smooth seasonal story through missing data.
That matters if the chart is used to discuss timing. A sparsely sampled median curve should not be used to declare an exact leaf-out date. The all-pixel file preserves the quality fields so that another reader can evaluate a different, explicitly documented screen.
The reproducible quality rules
We requested MCD15A2H at 42.5378° N, 72.1715° W, with a one-kilometre half-width and half-height. The service returns a five-by-five-cell grid with 463.312716528-metre cells. Five requests, each containing at most ten composites, cover the full 2023 series.
Before scaling, values outside the raw 0–100 interval are rejected. LAI is then raw Lai_500m multiplied by 0.1; FPAR is raw Fpar_500m multiplied by 0.01. Keeping those scale factors separate avoids a tenfold error.
The screen requires MODLAND_QC equal to zero, detector bit 2 equal to zero, and cloud-state bits 3–4 equal to zero. In FparExtra_QC, bits 0–6 must all be zero, screening for land and excluding the specified snow, aerosol, cirrus, cloud and shadow conditions. Biome bit 7 is retained without filtering. Algorithm class comes from FparLai_QC bits 5–7, and the admitted main-algorithm classes are summarized separately.
Keep the conclusion close to the measurement
The supported finding is a compact FPAR range alongside a wider high-LAI range in these screened retrievals, with saturation still labeled as usable. It is not a field measurement of leaf area and light absorption, a biomass estimate or a calculation of carbon sequestration. The downloadable summary, all-pixel and date-level files preserve the distinctions needed to ask those next questions carefully.
Sources and data
Source snapshots were retrieved on 6 October 2026. The observation dates and product versions are stated above; retrieval does not make a historical record current.
- NASA MCD15A2H subset via ORNL DAAC (Collection6.1;2023)
- NASA MCD15A2H subset via ORNL DAAC (Collection6.1;2023)
- NASA MCD15A2H subset via ORNL DAAC (Collection6.1;2023)
- NASA MCD15A2H subset via ORNL DAAC (Collection6.1;2023)
- NASA MCD15A2H subset via ORNL DAAC (Collection6.1;2023)
- MODIS LAI/FPAR user guide (Collection6; scaling and QA bit definitions)
- NASA MCD15A2H catalog (Collection6.1 DOI10.5067/MODIS/MCD15A2H.061)
Download B458-lai-fpar-summary.csv (CSV) · Download B458-lai-fpar-all-pixels.csv (CSV) · Download B458-lai-fpar-daily.csv (CSV)