Launch Watch · Evidence study
Published
Fix a 360-degree right-ascension jump with real Horizons data
Reproduce a real JPL Horizons angle wrap, preserve all 21 source rows, and turn a −359.77216° plotting jump into a +0.22784° step.
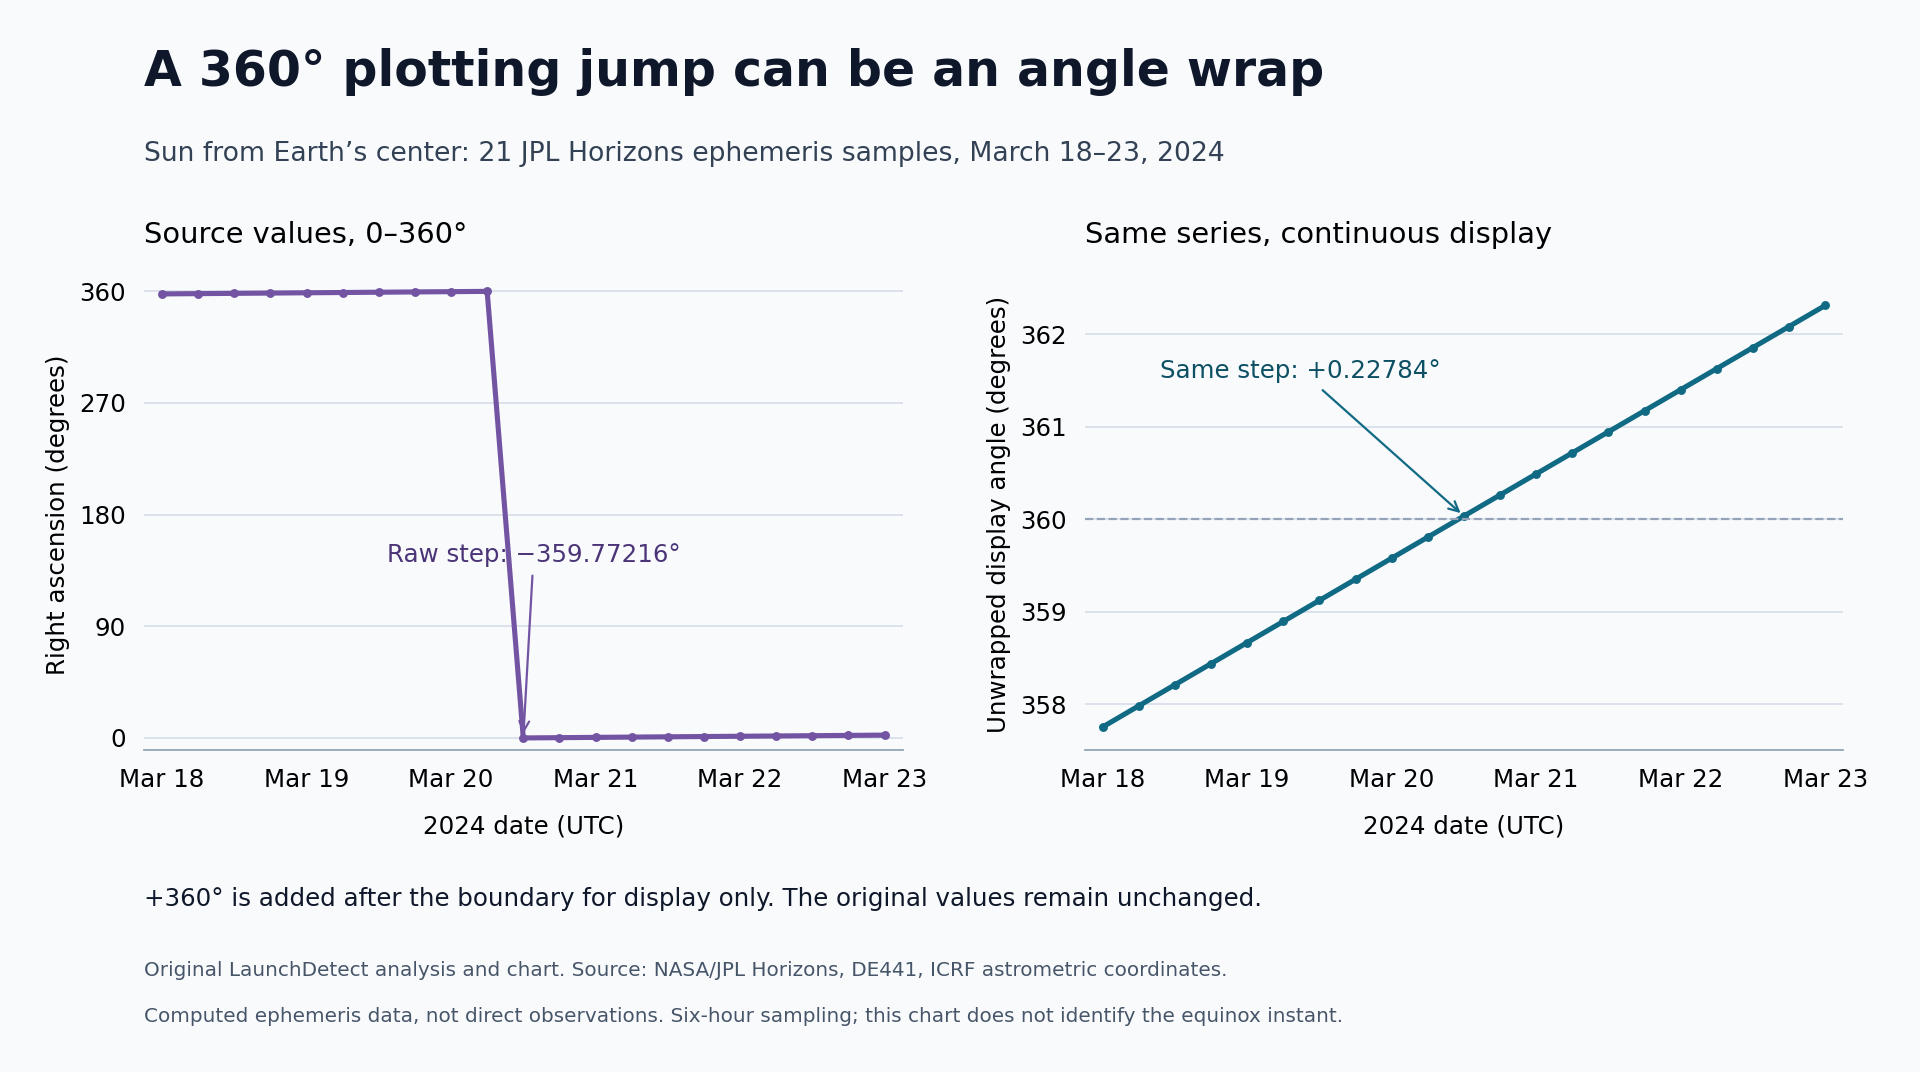
The Sun’s right ascension drops from 359.80594° to 0.03378° in two consecutive rows of a real NASA/JPL Horizons table. Connect those values with an ordinary line and the plot falls almost 360°. Preserve the same positions on a continuous display and the six-hour step is just +0.22784°.
This is a worked plotting repair using 21 computed ephemeris samples from March 18–23, 2024. The source values stay intact. A separate display column handles the circular coordinate.
The two rows that cause the plunge
The query asks Horizons for the Sun, target 10, as seen from Earth’s geocenter, center 500@399. It requests an observer table every six hours in degrees, with quantity 1 and the ICRF reference system. The returned header identifies DE441 and astrometric right ascension and declination. These are computed positions, not a series of telescope measurements. Horizons query documentation explains the request fields; the Horizons manual describes the output quantities.
| UTC | Source right ascension | Display offset | Continuous display |
|---|---|---|---|
| 06:00 | 359.80594° | 0° | 359.80594° |
| 12:00 | 0.03378° | 360° | 360.03378° |
Subtract the original numbers: 0.03378 − 359.80594 = −359.77216°. That calculation is correct for the printed numbers. Its interpretation as a continuous angular step is the problem: the coordinate crossed the end of its 0–360° range.
Adding 360° to the second display value gives 360.03378 − 359.80594 = +0.22784°. No sample was removed, smoothed or replaced. The second row still describes the source direction 0.03378°.
Keep the repair out of the source column
For this table, start a display offset at zero. Read the original right ascensions in chronological order. When an adjacent difference is below −180°, increase the offset by 360°; when it is above +180°, decrease the offset by 360°. Add that accumulated offset only to the display column.
The important assumption is that the intended angular change between adjacent samples is less than 180°. This rule chooses the nearer continuation around the circle. It cannot recover an unknown extra revolution from widely separated samples, and it cannot decide a precisely 180° ambiguity for you.
Walk through the exact boundary calculation
- Previous source value: 359.80594°.
- Current source value: 0.03378°.
- Raw difference: −359.77216°, below −180°.
- Increase the accumulated display offset from 0° to 360°.
- Current display value: 360.03378°. Subtract the previous display value to obtain +0.22784°.
- Check the inverse: 360.03378° modulo 360° returns 0.03378°.
The complete source and display columns are available in the 21-row CSV.
Keeping both columns makes the transformation auditable. A downstream consumer that expects right ascension within the original range can still use the source column. A chart can use the display column without pretending that Horizons returned values greater than 360°.
Test every interval, including the boring ones
The reconstruction retains all 21 timestamps and checks all 20 intervals. Each interval is exactly 21,600 seconds. There is one adjacent source jump greater than 180° in magnitude, between March 20 at 06:00 and 12:00 UTC.
After unwrapping, the smallest six-hour increment is 0.22755° and the largest is 0.22822°. The full display series rises from 357.75357° to 362.31049°, a change of 4.55692°. Those neighboring increments are a useful consistency check: the repaired boundary step falls within the behavior of the rest of this particular series.
The stronger check is reversible arithmetic. For every row, the continuous display value modulo 360° exactly reproduces the original decimal value. The calculation uses decimal arithmetic so that binary floating-point roundoff does not obscure this equality. Agreement here verifies the transformation against the retained table; it does not independently validate the astronomical ephemeris.
Preserve the context that gives the numbers meaning
The response identifies its API signature as version 1.2. The documentation inspected for this case advertises version 1.3. We retain the returned version rather than retroactively relabeling the data. The header, requested columns and time definition are the evidence for how to read this response. JPL’s API guidance also asks clients to check returned versions and use the service considerately.
Horizons labels the observer-table times UT; its returned explanation defines post-1962 entries as UTC. The March 2024 times above follow that definition. The printed decimal places are output formatting, not an independently established uncertainty estimate.
Nor does this boundary identify an exact equinox instant. ICRF astrometric right ascension crossing zero is a different quantity from the apparent-of-date definition used for an equinox. Six-hour sampling would also be a poor basis for claiming an exact event time without a suitable calculation.
A useful diagnostic before changing the physics
When an angular plot develops a near-360° cliff, inspect the coordinate range and the adjacent raw rows before treating the shape as motion. In this case, a reversible display offset fixes the discontinuity while leaving the scientific source untouched. That separation is the practical result: preserve the returned directions, document the sampling assumption, and make the chart’s transformation explicit.