Launch Watch · Spaceflight
Published
Mars’s 2023 command-pause plan was about solar interference, not a light-time spike
Compare NASA’s November 2023 Mars command plan with 721 hourly ephemeris samples: sky separation narrowed while one-way light time changed by only 20.72 seconds.
NASA’s November 2023 Mars announcement described a planned hold on sending commands from November 11 to 25 because solar interference could corrupt them. The delay caused by light’s travel time tells a different part of the story: across our month-long comparison, it changed by only 20.72 seconds.
We checked 721 hourly Earth-centered Mars samples from JPL Horizons. At the smallest sampled Sun–Mars angle, on November 18 at 05:00 UTC, the one-way light time was 21.009 minutes. The Sun–Mars separation on the sky had narrowed to 0.1153 degrees.
What NASA announced
The mission-operations announcement attributed the command hold to potentially disruptive ionized gas from the Sun’s corona along the communications path. It also described limited science activities that the rovers and orbiters would continue during the pause.
That source is an operational plan. It is not a packet-loss log or a spacecraft-by-spacecraft record of what was ultimately transmitted. We use its stated dates and rationale without turning them into a measured, continuous communications outage.
A small sky angle can coexist with nearly steady light time
| UTC sample | Sun–Mars angle (°) | One-way light time (min) |
|---|---|---|
| 1 Nov 2023, 00:00 | 5.2616 | 21.16614 |
| 18 Nov 2023, 05:00 | 0.1153 | 21.00901 |
| 1 Dec 2023, 00:00 | 3.8245 | 20.82084 |
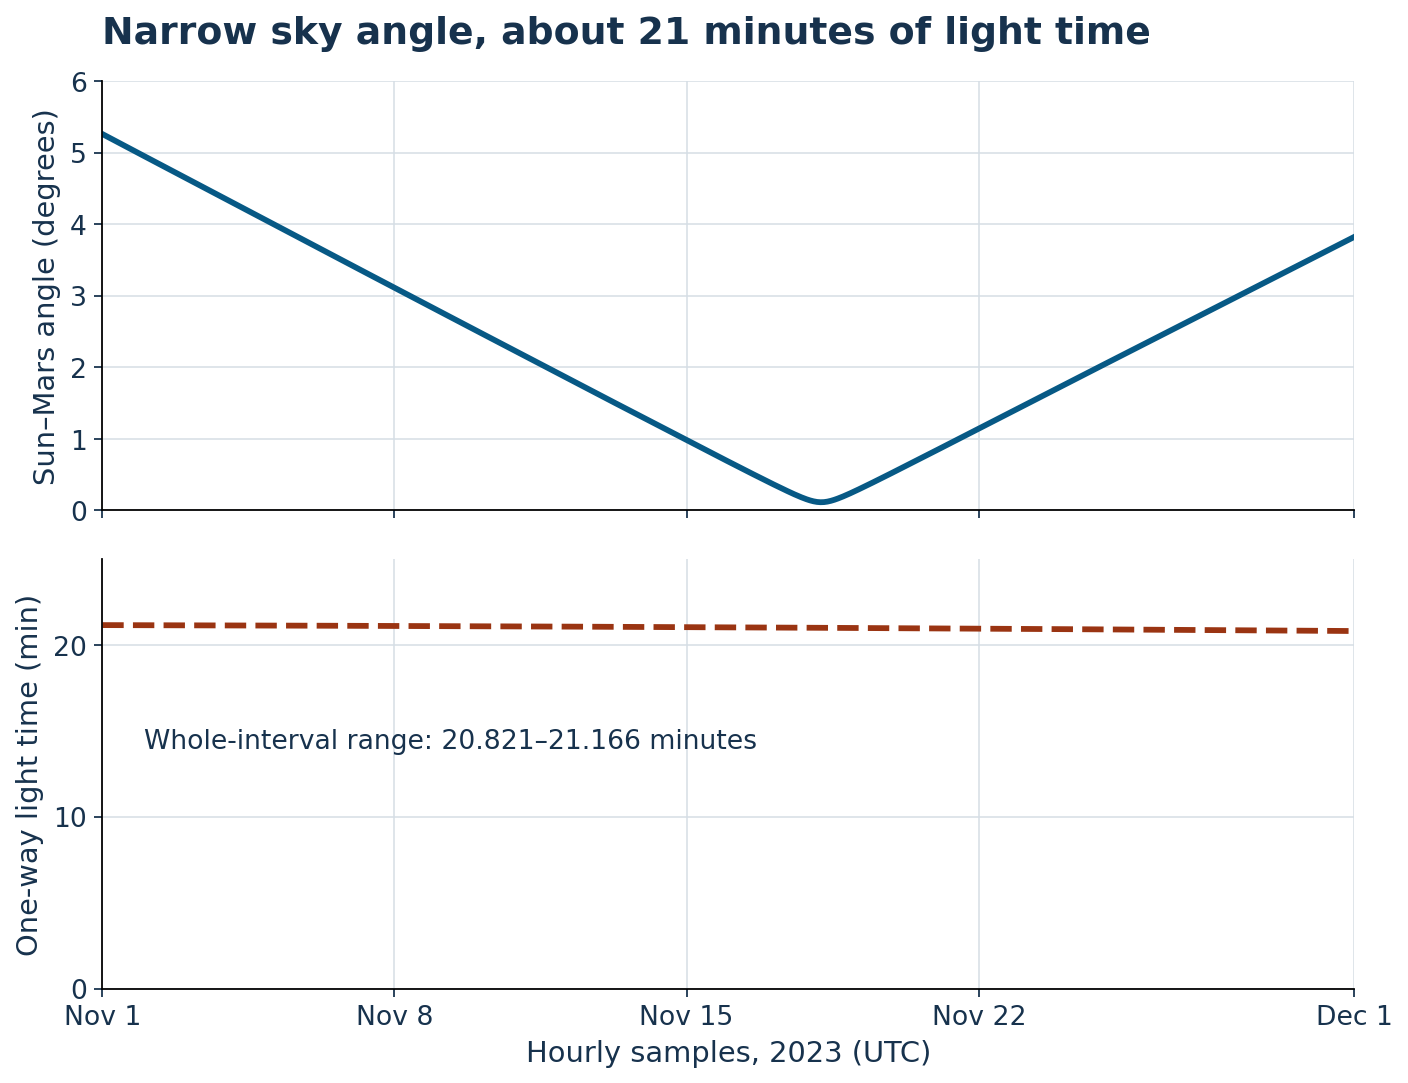
One-way light time runs from 21.16614 minutes at the first sample to 20.82084 minutes at the final endpoint. In fact, it decreases at every hourly step in this retained interval. Subtracting the endpoints and multiplying by 60 gives the 20.72-second range.
The sky angle follows a different pattern, narrowing toward conjunction before widening again. Angle asks how close Mars appears to the Sun from Earth. Light time asks how long a signal takes to cross the distance. Neither quantity can substitute for the other in a description of the communications problem.
A two-degree filter is a comparison, not a command rule
For an inspectable geometric window, we selected samples with a Sun–Mars angle no greater than 2 degrees. That leaves 317 hourly rows, from November 11 at 16:00 UTC through November 24 at 20:00 UTC.
Those rows lie near NASA’s announced dates, but this calculation does not establish a universal two-degree cutoff. Operations decisions can depend on the spacecraft, communications system and planned activity. Nor should 317 rows be called 317 hours of measured radio failure: they are sample points passing an angle filter.
A command pause also should not be described as all science stopping. The operational source specifically separates reduced commanding from the limited work already planned for the spacecraft.
Reproduce the comparison
The 721-row CSV gives UTC sample time, Earth–Mars range, one-way light time and apparent solar elongation. It spans November 1, 2023 at 00:00 through December 1 at 00:00, including the final endpoint.
The exact Horizons request uses Mars center, target 499, Earth center, 500@399, and observer quantities 19, 20, 21 and 23 at one-hour intervals. We identify the one-way light-time and Sun–observer–target columns from the response header, then calculate extrema and the optional angle filter.
These are modeled observer-ephemeris values. They do not measure signal quality or downtime, and the hourly minimum is not an exact conjunction-time solution. Source response bytes were retained on October 5, 2026 so the calculation can be checked against a fixed input.
For the broader chain between image capture and reception, see why spacecraft pictures take time to arrive. This dated comparison isolates one specific issue: conjunction geometry alongside, rather than confused with, travel time.
Sources and credit
- NASA’s 2023 Mars conjunction operations announcement.
- JPL Horizons manual, for observer quantities and conventions; the exact data request is linked above.
Original chart and calculations: LaunchDetect. Numerical ephemeris: JPL Horizons. No spacecraft artwork, source video or logo is reproduced, and no NASA or JPL endorsement is implied.