Launch Watch · Spaceflight
Published
Mars Climate Orbiter: why the record contains 226, 150–170, 110 and 57 kilometers
Follow Mars Climate Orbiter’s 226, 150–170, 110 and 57 km approach figures through target, estimate and reconstruction, then audit the impulse-unit error.
One account puts Mars Climate Orbiter’s intended close approach at 226 kilometers. Another gives 150 kilometers. The investigation describes a late estimate as low as 110 kilometers and a post-event reconstruction of 57 kilometers. These numbers record changing knowledge of the encounter, rather than four measurements of the spacecraft descending through the atmosphere.
The distinction matters because the famous unit error occurred in the ground navigation model. It changed how thruster impulses were represented and, consequently, how the trajectory was estimated. Multiplying an altitude by the unit-conversion factor will not reconstruct the spacecraft’s path.
Read the altitude as a value plus an evidence state
The Mars Climate Orbiter Mishap Investigation Board’s Phase I report, dated November 10, 1999, supplies the following sequence on printed pages 13–14. Periapse is the point of closest approach; these figures describe altitude above Mars, not distance from its center.
| Value | Evidence state | When it applied |
|---|---|---|
| 226 km | Target for the first periapse after insertion | TCM-4 computed September 8; maneuver executed September 15, 1999 |
| 150–170 km | Updated navigation estimates | The week between TCM-4 and September 23 insertion |
| As low as 110 km | Last pre-insertion low estimate | More accurate tracking-data processing completed about one hour before insertion |
| 57 km | Corrected post-event reconstruction | Navigation reanalysis using data through loss of signal |
The table’s first row is a maneuver target. The two middle rows are estimates produced as the navigation team processed additional information. The last row comes from corrected modeling after the spacecraft was lost. A plot that joins these figures as a continuous descent would invent a trajectory the report does not provide.
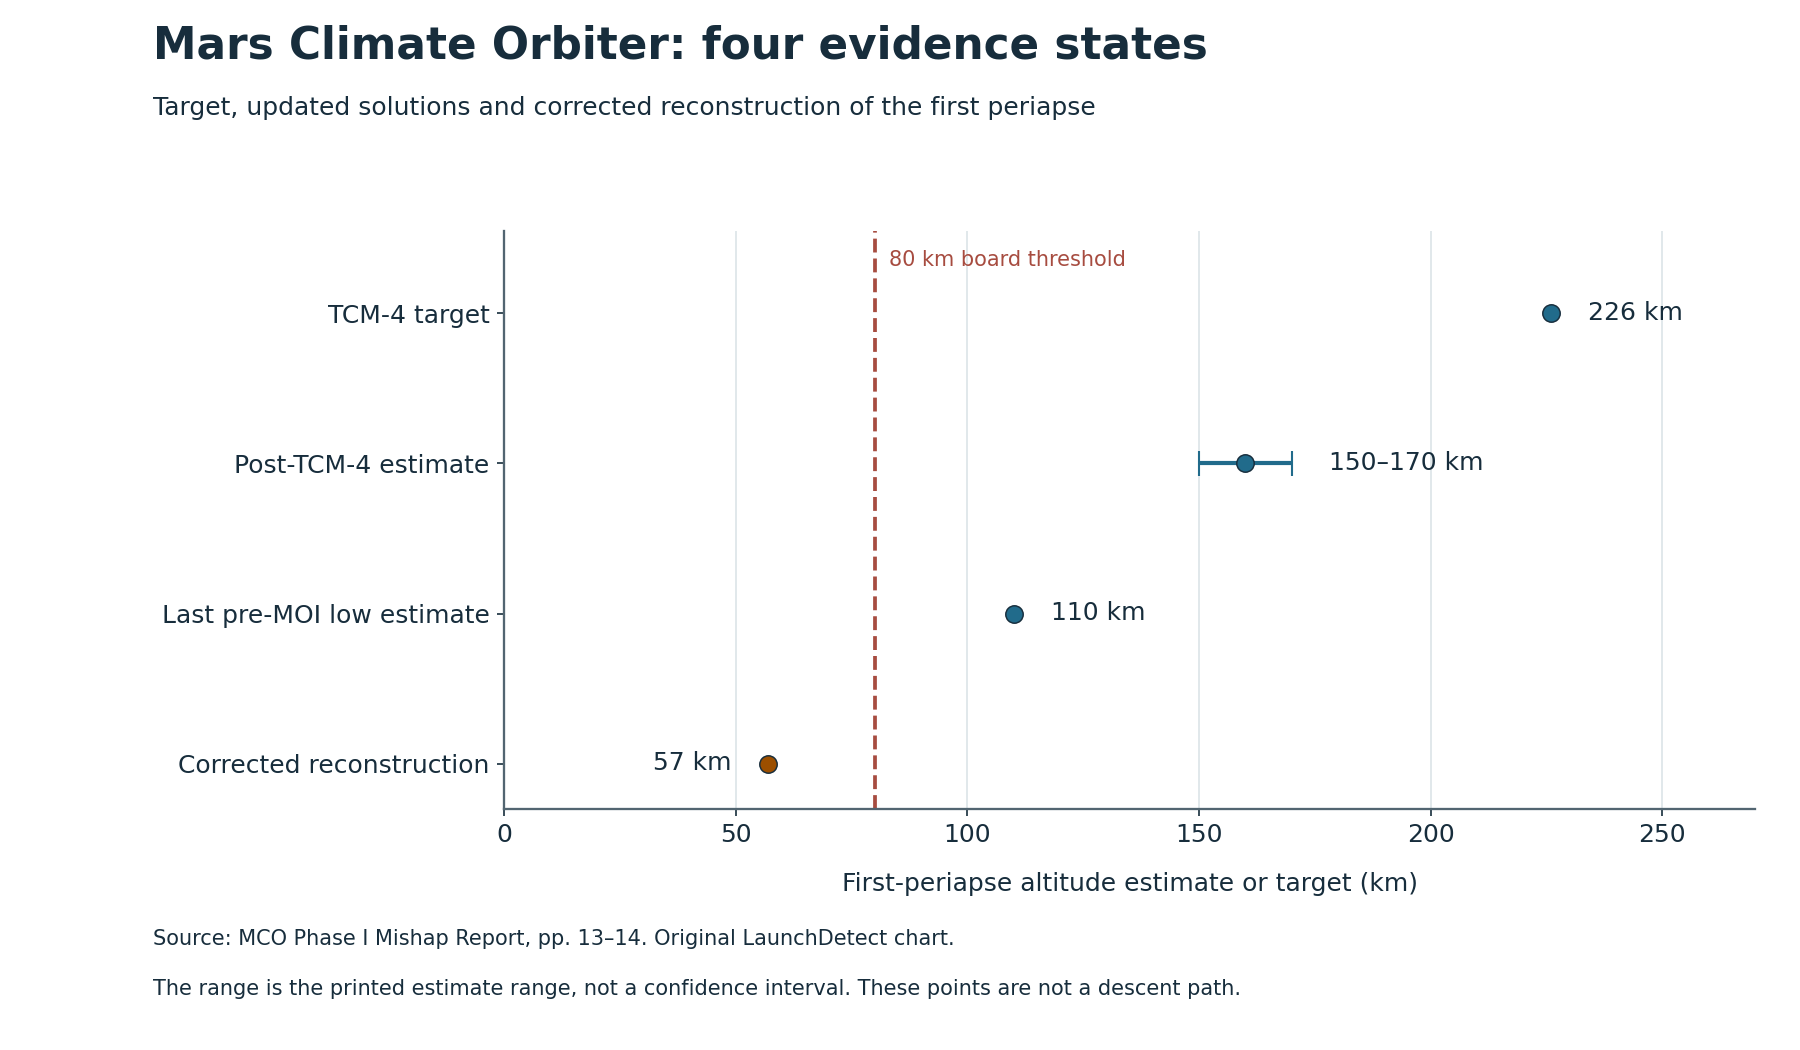
The 150–170-kilometer bar preserves the report’s stated range. It is not a confidence interval derived by this analysis, and its midpoint of 160 kilometers is used only to position the range in the drawing. The 110-kilometer entry likewise preserves “as low as,” rather than presenting that value as a complete uncertainty description.
The final estimate and the reconstruction fall on opposite sides of the threshold
The board used 80 kilometers as the minimum periapse altitude considered survivable. The last pre-insertion low estimate, 110 kilometers, sat 30 kilometers above it. The corrected 57-kilometer reconstruction sat 23 kilometers below it.
Those two subtractions make the consequence easier to see. They do not assign a survival probability to either value: the threshold is the board’s stated operational criterion, not a universal sharp boundary for every spacecraft and atmospheric condition.
The difference between the 226-kilometer target and the 57-kilometer reconstruction is 169 kilometers. That reproduces the scale of the board’s approximately 170-kilometer shortfall. It remains a target-to-reconstruction comparison; it is not an independently observed altitude error measured by this article.
What the factor of 4.45 actually multiplies
The report identifies an interface failure in ground software. The Angular Momentum Desaturation file carried thruster impulse data in pound-force-seconds, while the receiving navigation software expected newton-seconds. The report gives the approximate conversion factor as 4.45. The onboard computation described by the board used metric units correctly.
Take one illustrative input of 1 pound-force-second. Using the report’s rounded factor, it represents about 4.45 newton-seconds. If software treats the bare numeric value “1” as one newton-second, it models about 22.5% of that impulse: 1 ÷ 4.45 × 100. The modeled amount is about 77.5% below the correctly converted amount.
This example explains the numerical scaling error at the data interface. The “1” is a teaching input, not a claimed measurement of a particular MCO thruster firing. Actual trajectory effects also depend on when forces act and their directions, so the factor cannot be applied directly to altitude or spacecraft speed.
A practical audit would check the unit declared by the file specification, the unit actually produced, and the unit assumed by the consumer. A column containing plausible-looking numbers can pass through a system while representing the wrong physical quantity. Here, the report supplies evidence of precisely that mismatch; there is no need to infer one from the altitude differences alone.
What the radio record establishes
The board reports that loss of carrier occurred 49 seconds earlier than predicted during the September 23 encounter. The signal was not reacquired after the expected occultation interval. That timing discrepancy is an observation distinct from the later 57-kilometer navigation solution.
The Phase I report leaves two possible final outcomes: destruction in the atmosphere or a return to heliocentric space after atmospheric passage. It does not provide a uniquely observed final fate. An account saying the board proved the spacecraft burned up would overstate this particular record.
Why an earlier NASA account says 60 and 85 kilometers
A NASA public account labeled September 23, 1999 gives an approach around 60 kilometers, a planned 150 kilometers and a survivability figure around 85 kilometers. That page carries a later update date as well. Its values should retain their attribution rather than being silently substituted into the November board report.
For the arithmetic in this article, the source is consistently the Phase I report: 226, 150–170, 110 and 57 kilometers, with its 80-kilometer threshold. The earlier public page helps explain why readers encounter other numbers. It is not evidence that each of those numbers had the same status or was available at the same time.
Method and limits
We extracted the four evidence states from the investigation, preserved the range and low-estimate wording, and independently calculated three altitude differences and the illustrative impulse fraction. The evidence-state CSV includes the source page and the meaning of each row.
No raw tracking data was fitted, no atmospheric model was run, and no exact orbit was recovered. The chart is an account of the investigation’s evidence. Its useful lesson is specific: keep the target, the contemporary solution and the corrected reconstruction attached to their dates and definitions before comparing their numbers.
Sources
- Mars Climate Orbiter Mishap Investigation Board Phase I Report (November 10, 1999). Printed/PDF pp.13-14 for successive periapse estimates; pp.16-18 for units and observability; executive summary pp.6-7 for final-fate uncertainty.
- NASA NSSDCA: Mars Climate Orbiter arrival account. Page reports 60 vs planned 150 km and about 85 km survivability. Page last-updated date is later; keep it separate from the board’s 57/80 km values.
Charts and calculations: LaunchDetect, using the linked factual records. No NASA or JPL endorsement is implied.