Separating a missing value from a measured zero in launch research
A blank cell becomes dangerous when a spreadsheet, chart, or export quietly turns it into zero. The resulting number looks like a measurement even when no usable value was available.
Before calculating with a launch-research table, define what each column measures and what its non-values mean. A valid reported zero can belong in a calculation. A missing reading, an inapplicable quantity, and a rejected reading need their own explanation. This guide focuses on that data-representation problem, rather than whether an absent detection proves that an event did not happen.
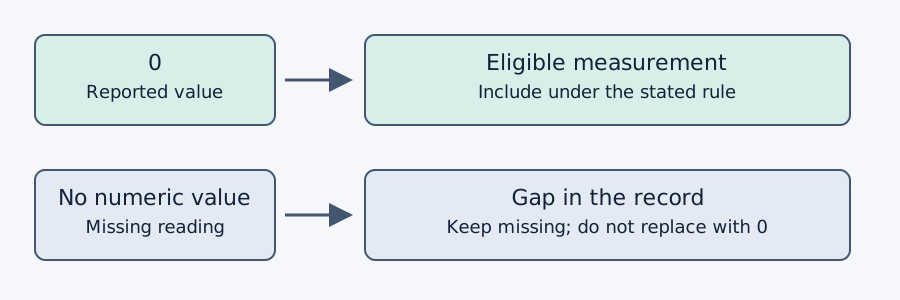
Read the value together with its status
The numeral alone is not enough. You also need the variable definition, units, missing-value convention, and any relevant quality information. A zero can be a legitimate result at the source’s reported precision, but it can also be a placeholder or faulty reading.
A useful real-world caution comes from the NIST Net-Zero dataset notes. For its 2013–2014 building test data, NIST documents missing entries marked “NA” and notes that some sensor failures produced erroneous zeros that remained in the dataset. This is a building dataset, not a satellite instrument rule. It illustrates why a numerical value still needs its source documentation.
Do not generalize that example into “all zeros are bad.” The task is to preserve the meaning documented for the particular measurement.
Check scientific-file metadata before arithmetic
For data governed by the CF Conventions version 1.13, section 2.5.1, attributes such as _FillValue and valid_range identify special missing or invalid values. CF recommends _FillValue when one missing marker is needed. For packed data, missing-value checks apply to stored values before scale and offset transformations; missing markers should not be transformed.
That guidance concerns the scientific files to which it applies. It does not define every web table, CSV, or API. Consult the actual product documentation and preserve the distinction through any export. Do not assume that zero, an empty string, “NA,” and a special sentinel number are interchangeable.
A six-state worksheet
These are proposed working labels for an editorial research table, not a new scientific standard. Keep the source value separately from the usable numeric value and the reason for the status. Use more specific labels if the source provides them.
| State | Synthetic example | Treatment in a measurement summary |
|---|---|---|
| Measured zero | A valid change measurement is reported as 0 units | Include as zero if it meets the defined eligibility rule |
| Missing | The expected measurement is absent from the supplied record | No numeric value; report the gap |
| Not applicable | The column’s quantity does not apply to this row | No numeric value; explain why this row is outside the quantity’s scope |
| Rejected | A supplied reading fails the stated quality rule | Retain the original reading for traceability; exclude from the eligible measurement calculation |
| Not processed | Input exists, but the required processing step has not run | No result yet; record the pending step |
| Unknown | A blank has arrived without a documented explanation | No numeric value; investigate its meaning |
The measured-zero row means “accepted as a reported measurement under the stated rule.” It does not promise an exact physical zero, unlimited precision, or a successful mission. The rejected row is also different from missing: it preserves the fact that a reading existed and explains why it was not used.
For every nonnumeric state, record the reason and where it came from. If you cannot recover the reason, use unknown rather than guessing that the instrument failed or that nothing occurred.
A small mean that changes when blanks become zeros
Consider a separate, entirely synthetic exercise with five expected readings of a signed change in an arbitrary quantity. The units are simply “example units.” This is not launch data, brightness temperature, or a detector-performance measure.
| Reading | Usable value | Status |
|---|---|---|
| R1 | 0 | Measured and eligible |
| R2 | 4 | Measured and eligible |
| R3 | 8 | Measured and eligible |
| R4 | No value | Missing |
| R5 | No value | Missing |
The sum of the three eligible values is 0 + 4 + 8 = 12. Their mean is 12 divided by 3, or 4 example units. Report it as the mean of three available eligible readings, with two of five expected readings missing.
If the two missing entries are silently replaced with zero, the calculation becomes 12 divided by 5, or 2.4 example units. That answer describes an invented five-value series. If the genuine measured zero is instead discarded, the calculation becomes 12 divided by 2, or 6 example units. That answer wrongly removes a valid observation.
The correctly described available-reading mean is therefore 4, with its denominator and gaps stated. It is not automatically an unbiased estimate for all five expected readings. Deciding how to handle missingness for a scientific inference requires the study design and a justified method; this arithmetic exercise does not supply one.
Keep the denominator next to the result
Before presenting a mean, count, rate, or chart, state the eligible population. Are you describing supplied rows, usable measurements, expected observations, or something else? Those counts can differ even when every row is represented honestly.
For this worksheet, keep a short reconciliation beside the result: expected rows, applicable rows, processed rows, eligible readings, and excluded or unresolved rows with reasons. Some categories may describe successive stages rather than disjoint groups. Define them so readers do not add overlapping counts together.
Use a visible word such as “missing” or “not processed” in a reader-facing table. Do not rely on an empty cell or color alone. In a chart, distinguish a gap from a plotted zero and explain any omitted rows in the caption.
Review the transformation before you trust the summary
Ask five questions when a table changes format:
- Did any blank, null, text marker, or sentinel become numeric zero?
- Did a legitimate zero disappear because a rule treated it as empty?
- Were missing markers recognized before any relevant numeric transformation?
- Did quality exclusions keep their original value and reason somewhere traceable?
- Does the displayed result name its actual denominator and remaining gaps?
The evidence-lifecycle guide helps when a row’s timing is unclear; the launch-claim verification guide addresses the broader interpretation. At the data-table level, the essential habit is simple: carry value, status, and meaning together all the way to the reader.