Launch Watch · Satellite
Published
MOD16’s year-end trap: a higher ET total with a lower daily rate
A real MOD16 grid cell rises from 4.2 to 4.4 mm, but its five- and six-day periods yield a lower daily rate. Reproduce the denominator check.
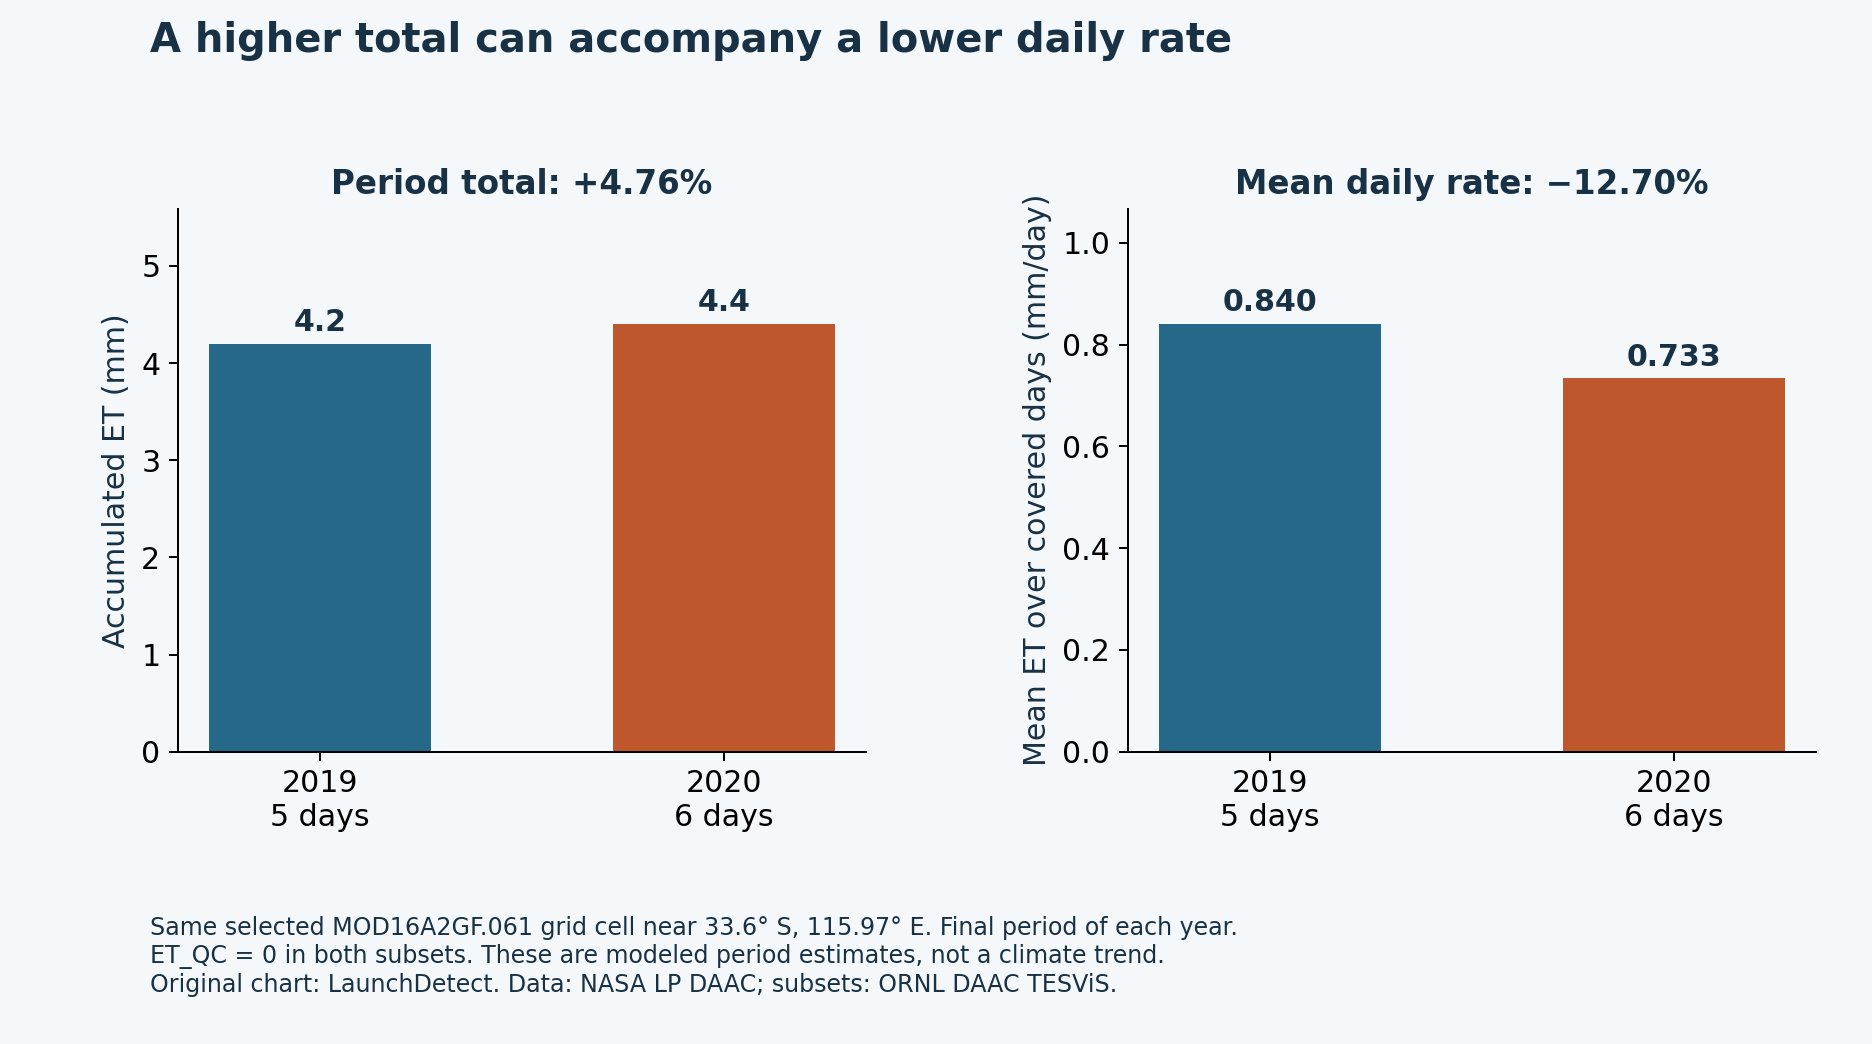
At one matched MOD16A2GF grid cell in southwestern Australia, the final period’s estimated evapotranspiration rises from 4.2 mm in 2019 to 4.4 mm in 2020. But the first period contains five days and the second contains six. Divide by the actual duration and the mean daily rate falls from 0.840 to 0.733 mm/day.
Both comparisons are valid descriptions of different quantities: the period total increases 4.76%, while the rate decreases 12.70%. The mistake would be calling the product’s last annual interval eight days long and presenting the resulting division as its mean daily rate.
The actual granules have five and six days
The MOD16A2GF Version 6.1 product description says ET and potential ET are accumulated over the composite period, and that the last period of a year has five or six days. Its nominal “8-Day” product name and ET unit label do not make the final interval eight days long.
We requested the ET_500m and ET_QC_500m bands from ORNL DAAC TESViS around 33.6° S, 115.97° E for day 361 in each year. The returned 5-by-5 subsets share the same grid origin and cell size. We selected their center cell, row 2 and column 2 using zero-based indexing.
| Year | Actual coverage (inclusive) | Calendar days | Selected raw ET | ET_QC |
|---|---|---|---|---|
| 2019 | 27–31 December 2019 | 5 | 42 | 0 |
| 2020 | 26–31 December 2020 | 6 | 44 | 0 |
The year boundary explains the difference. Day 361 is 27 December in 2019, leaving five calendar days through 31 December. In leap year 2020, it is 26 December, leaving six. The corresponding NASA CMR records confirm those start and end dates rather than requiring us to infer them only from the product name.
The subset processing stamps match the exact Version 6.1 granule identifiers: MOD16A2GF.A2019361.h27v12.061.2021005044123 and MOD16A2GF.A2020361.h27v12.061.2021024211618. That provenance check matters because an otherwise plausible sample could come from a different processing version.
Scale first, then use the correct denominator
The product’s ET scale factor is 0.1. The two stored integers therefore become 42 × 0.1 = 4.2 and 44 × 0.1 = 4.4 kg/m² of water over their respective periods. One kg/m² of water is one millimetre of equivalent water depth, giving the totals used here.
For this question, the rate is the total divided by the number of covered days: 4.2 / 5 = 0.840 mm/day, and 4.4 / 6 = 0.733333… mm/day. We are not reconstructing six separate daily observations; we are calculating an interval-average rate from each accumulated estimate.
| Year | Period total (mm) | Divide by actual days (mm/day) | Divide by 8 (mm/day) | Shortcut below correct rate |
|---|---|---|---|---|
| 2019 | 4.2 | 0.840 | 0.525 | 37.5% |
| 2020 | 4.4 | 0.733333… | 0.550 | 25.0% |
The wrong denominator does more than reduce both numbers. Because it applies the same divisor to unequal-duration totals, it preserves their upward direction: 0.525→0.550 would look like an increase in daily ET. The correctly normalized rates move downward.
This does not make period totals meaningless. If the question is how much modeled ET accumulated over each named interval, 4.2 and 4.4 mm answer it. If the question concerns an average per day, duration belongs in the denominator. State the quantity before deciding which comparison to show.
Quality and matching checks come before the arithmetic
Both selected integers are inside the documented ET valid range of −32,767 to 32,700, and both accompanying ET_QC values are 0. We retained the quality-band responses separately, checked the same date and processing stamp, and matched the grid origins and cell size. A request coordinate selects a grid cell; it does not make the estimate a subpixel point measurement.
In a larger workflow, mask fill and special nonvegetated codes according to the product documentation before scaling or averaging. Read ET_QC using the MOD16 legend. A zero quality value does not eliminate modeling uncertainty, guarantee ecological accuracy or mean the same thing as a zero QA value in an unrelated MODIS product.
Keep the variables separate too. The MOD16 user guide and product catalog distinguish accumulated ET/PET from LE/PLE, whose latent-heat values are already expressed as daily energy averages. Applying this ET denominator recipe to LE would be a units error.
Reproduce the one-cell result
The 50-cell input extract (CSV) retains all 25 ET and quality values for each year, with the selected center marked. The two-row calculation (CSV) gives the raw values, scale, exact dates, day counts, rates and shortcut errors. The original subset and granule records are linked below.
- Match the date, version, processing stamp and grid between ET and quality data.
- Select the same grid cell and check valid range and product-specific QA.
- Count the covered calendar days inclusively from the granule start and end dates.
- Multiply the stored ET value by 0.1; express the resulting water mass per area as equivalent depth.
- Divide by five or six for these two year-end records, and label the result mm/day.
What the sign reversal does not establish
MOD16 is a modeled evapotranspiration product, not a direct in-situ flux reading. Two short periods in different years at one cell do not establish a climate trend, a land-cover cause or an irrigation requirement. Their date spans also differ by a day, so normalization does not turn them into identical temporal samples.
The useful result is narrower and reproducible: unequal accumulation periods can reverse the direction of a total-versus-rate comparison. Check the actual temporal support before treating an “8-day” product as an eight-day divisor.
Sources and data-use note
- MOD16A2GF.061 product and citation and Version 6.1 user guide: units, scale, quality and final-period definition.
- 2019 ET subset and 2019 quality subset; 2020 ET subset and 2020 quality subset: actual retained values.
- 2019 CMR granule record and 2020 CMR granule record: precise coverage and granule identifiers.
- LP DAAC data-citation FAQ: permitted reuse and requested attribution.
Sources checked 4 October 2026. Original analysis and visualization by LaunchDetect; no source imagery is reproduced.
The ORNL subset links are API endpoints: request them with the Accept: application/json header. The downloadable CSVs in this article provide the reviewed values for reading without an API client.