Launch Watch · Launch Watch · Evidence study
Published
Gross carbon uptake is not net storage: a MODIS GPP–NPP comparison
Two 2023 MODIS windows show NPP at about 54–56% of GPP. The difference is plant-respiration accounting, and neither product alone measures ecosystem carbon storage.
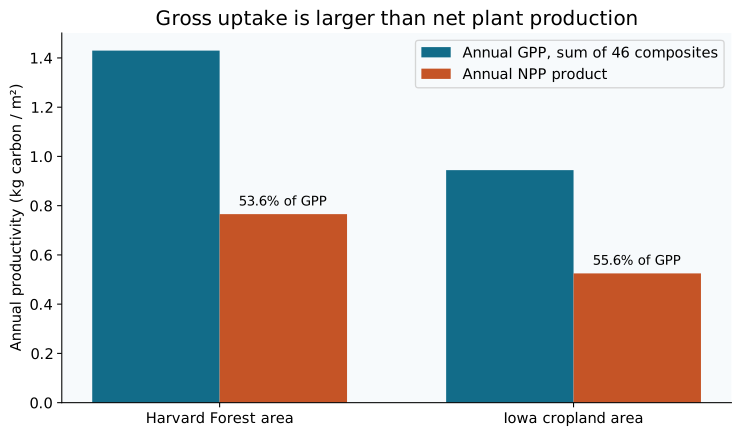
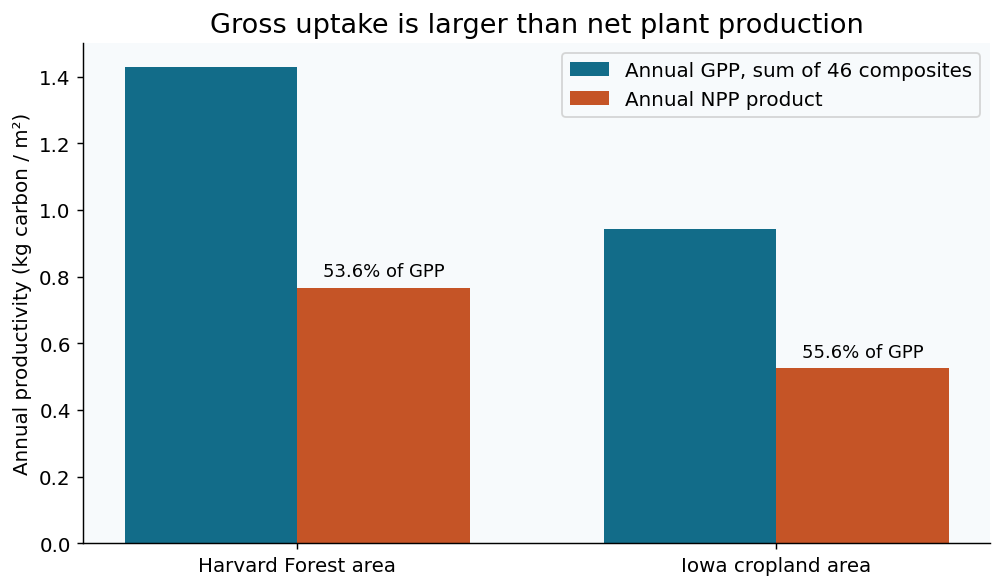
In a 25-cell window near Harvard Forest, the MODIS products estimate mean 2023 gross primary productivity at 1.429636 kilograms of carbon per square metre and net primary production at 0.765664. NPP is about 53.56% of GPP. A similarly sized Iowa cropland-area window gives 55.61%.
Those ratios show how much the accounting definition matters. Gross carbon uptake, net plant production and long-term ecosystem storage are different quantities. Reading a GPP map as a stored-carbon map would skip important terms in that accounting.
Open full-size figure · Download PNG figure
Follow the carbon definition
The MOD17 guide distinguishes gross primary productivity from net primary production after plant respiration. In the Harvard Forest-area window, GPP minus NPP is 0.663972 kg C/m²; in the Iowa window, it is 0.419164 kg C/m².
Those differences belong to the product’s plant-respiration accounting. They are not measurements of every carbon loss from the ecosystem. NPP does not subtract all microbial respiration, harvest, fire or other carbon exports. Neither value by itself is a carbon-credit quantity.
| Window | Annual GPP | Annual NPP | GPP minus NPP | NPP/GPP (%) |
|---|---|---|---|---|
| Harvard Forest area | 1.429636 | 0.765664 | 0.663972 | 53.56 |
| Iowa cropland area | 0.944188 | 0.525024 | 0.419164 | 55.61 |
Build an annual total from the right units
The GPP input is MOD17A2HGF, a gap-filled eight-day product. We sum all 46 intervals in 2023 for each pixel and multiply by the 0.0001 scale factor. The interval values are already integrated over their periods, so multiplying each by eight again would overcount.
The shorter period at year-end is already represented in the supplied value. A correct annual sum keeps that period along with the others instead of assuming that every interval must represent eight full days.
For NPP, we use the 2023 annual MOD17A3HGF field with the same 0.0001 scale factor. The two products are joined on the exact same grid coordinates, giving 25 matched cells at each site. The reported ratio is mean NPP divided by mean annual GPP, not an average of individual pixel ratios.
Retain the gap-filling information
All 46 GPP composites and all 25 pixels per site have valid numeric values. That does not mean every underlying vegetation input was directly observed without gaps. The annual Npp_QC field reports growing-season input gap-filling fractions of 26–44% in the forest window and 23–34% in the cropland window.
Those percentages describe gap-filled FPAR/LAI input use. They are not probabilities that the final NPP estimates are correct. The distinction matters because a valid annual modeled value can still depend on reconstructed inputs.
We retain the interval-level Psn_QC fields in the data. Deleting cloudy intervals and then summing only what remains would create a partial-year total with a different meaning. This analysis instead preserves the gap-filled product and reports its quality context.
Exactly which windows were compared?
The forest-area request is centered at 42.5378° N, 72.1715° W. The Iowa cropland-area request is centered at 42.028° N, 93.744° W. Each uses a one-kilometre half-width and half-height and returns a five-by-five grid.
We verify matched cell coordinates, numeric ranges and the full set of 46 periods before calculating annual cell sums. We then average the 25 cell values, calculate the difference and ratio of means, and preserve the pixel and eight-day tables alongside the summary.
Two windows cannot rank whole ecosystems
The products are modeled, satellite-informed productivity estimates, not direct CO₂ flux measurements. These two small landscapes do not establish that one biome is universally more efficient than another, and this comparison does not attempt a causal cross-site analysis or significance test.
The useful takeaway is the accounting chain. Start with the product’s definition and integration period, build the annual value without rescaling time twice, and keep quality information attached. If the real question is ecosystem storage, additional carbon-flow and stock evidence is needed beyond either GPP or NPP.
Sources and data
Source snapshots were retrieved on 6 October 2026. The observation dates and product versions are stated above; retrieval does not make a historical record current.
- NASA MOD17A2HGF GPP subset via ORNL DAAC (Collection 6.1; 2023)
- NASA MOD17A2HGF GPP subset via ORNL DAAC (Collection 6.1; 2023)
- NASA MOD17A2HGF GPP subset via ORNL DAAC (Collection 6.1; 2023)
- NASA MOD17A2HGF GPP subset via ORNL DAAC (Collection 6.1; 2023)
- NASA MOD17A2HGF GPP subset via ORNL DAAC (Collection 6.1; 2023)
- NASA MOD17A2HGF GPP subset via ORNL DAAC (Collection 6.1; 2023)
- NASA MOD17A2HGF GPP subset via ORNL DAAC (Collection 6.1; 2023)
- NASA MOD17A2HGF GPP subset via ORNL DAAC (Collection 6.1; 2023)
- NASA MOD17A2HGF GPP subset via ORNL DAAC (Collection 6.1; 2023)
- NASA MOD17A2HGF GPP subset via ORNL DAAC (Collection 6.1; 2023)
- NASA MOD17A3HGF forest-area annual subset (Collection 6.1; selected 2023)
- NASA MOD17A3HGF Iowa-area annual subset (Collection 6.1; selected 2023)
- MOD17 GPP and NPP user guide (Collection 6.1; definitions, units, annual Npp_QC)
Dataset credits
- S. Running, Zhao, M. 2021. MOD17A2HGF MODIS/Terra Gross Primary Productivity Gap-Filled 8-Day L4 Global 500 m SIN Grid V061. NASA EOSDIS Land Processes DAAC. https://doi.org/10.5067/MODIS/MOD17A2HGF.061
- S. Running, Zhao, M. 2021. MOD17A3HGF MODIS/Terra Net Primary Production Gap-Filled Yearly L4 Global 500 m SIN Grid V061. NASA EOSDIS Land Processes DAAC. https://doi.org/10.5067/MODIS/MOD17A3HGF.061
- ORNL DAAC. 2018. Terrestrial Ecology Subsetting & Visualization Services (TESViS) RESTful Web Service. ORNL DAAC. https://doi.org/10.3334/ORNLDAAC/1600
Download B451-carbon-summary.csv (CSV) · Download B451-carbon-pixels.csv (CSV) · Download B451-carbon-8day.csv (CSV)