Launch Watch · Satellite
Published
MCD12Q1 class codes: same year, different land-cover dictionaries
A 25-cell MODIS audit finds 23 numerical mismatches between two schemes in the same 2020 file. Similar labels can differ, and matching numbers can mislead.
The same center cell in a 2020 MODIS land-cover product is code 10 in LC_Type1 and code 1 in LC_Type3. Both labels are grassland-related. The numbers differ because the two bands use different classification dictionaries, not because we have compared two dates.
In the surrounding 5-by-5 subset, 23 of 25 co-located code pairs differ. The two numerical matches are just as revealing: both read 5, but one dictionary calls 5 mixed forests and the other calls it evergreen broadleaf forests. Neither inequality nor equality is safe to interpret without the scheme.
One annual granule, two different questions
MCD12Q1.061 supplies multiple annual land-cover classification schemes. LC_Type1 uses the International Geosphere-Biosphere Programme (IGBP) legend. LC_Type3 uses the Leaf Area Index (LAI) classification legend. Despite the name, LC_Type3 contains categories; its values are not numerical leaf-area-index measurements.
We retrieved LC_Type1, LC_Type3 and QC around 33.6° S, 115.97° E through ORNL DAAC TESViS. All three returned 5-by-5 arrays have the same grid origin, cell size, tile, annual timestamp and processing stamp. NASA’s granule record identifies MCD12Q1.A2020001.h27v12.061.2022172015500, covering 1 January through 31 December 2020.
The API’s 2020-01-01 calendar label is the annual-product timestamp. It does not mean the landscape was observed only on New Year’s Day. This audit compares two schemes within that same annual product, not 2019 against 2020 or one scene against another.
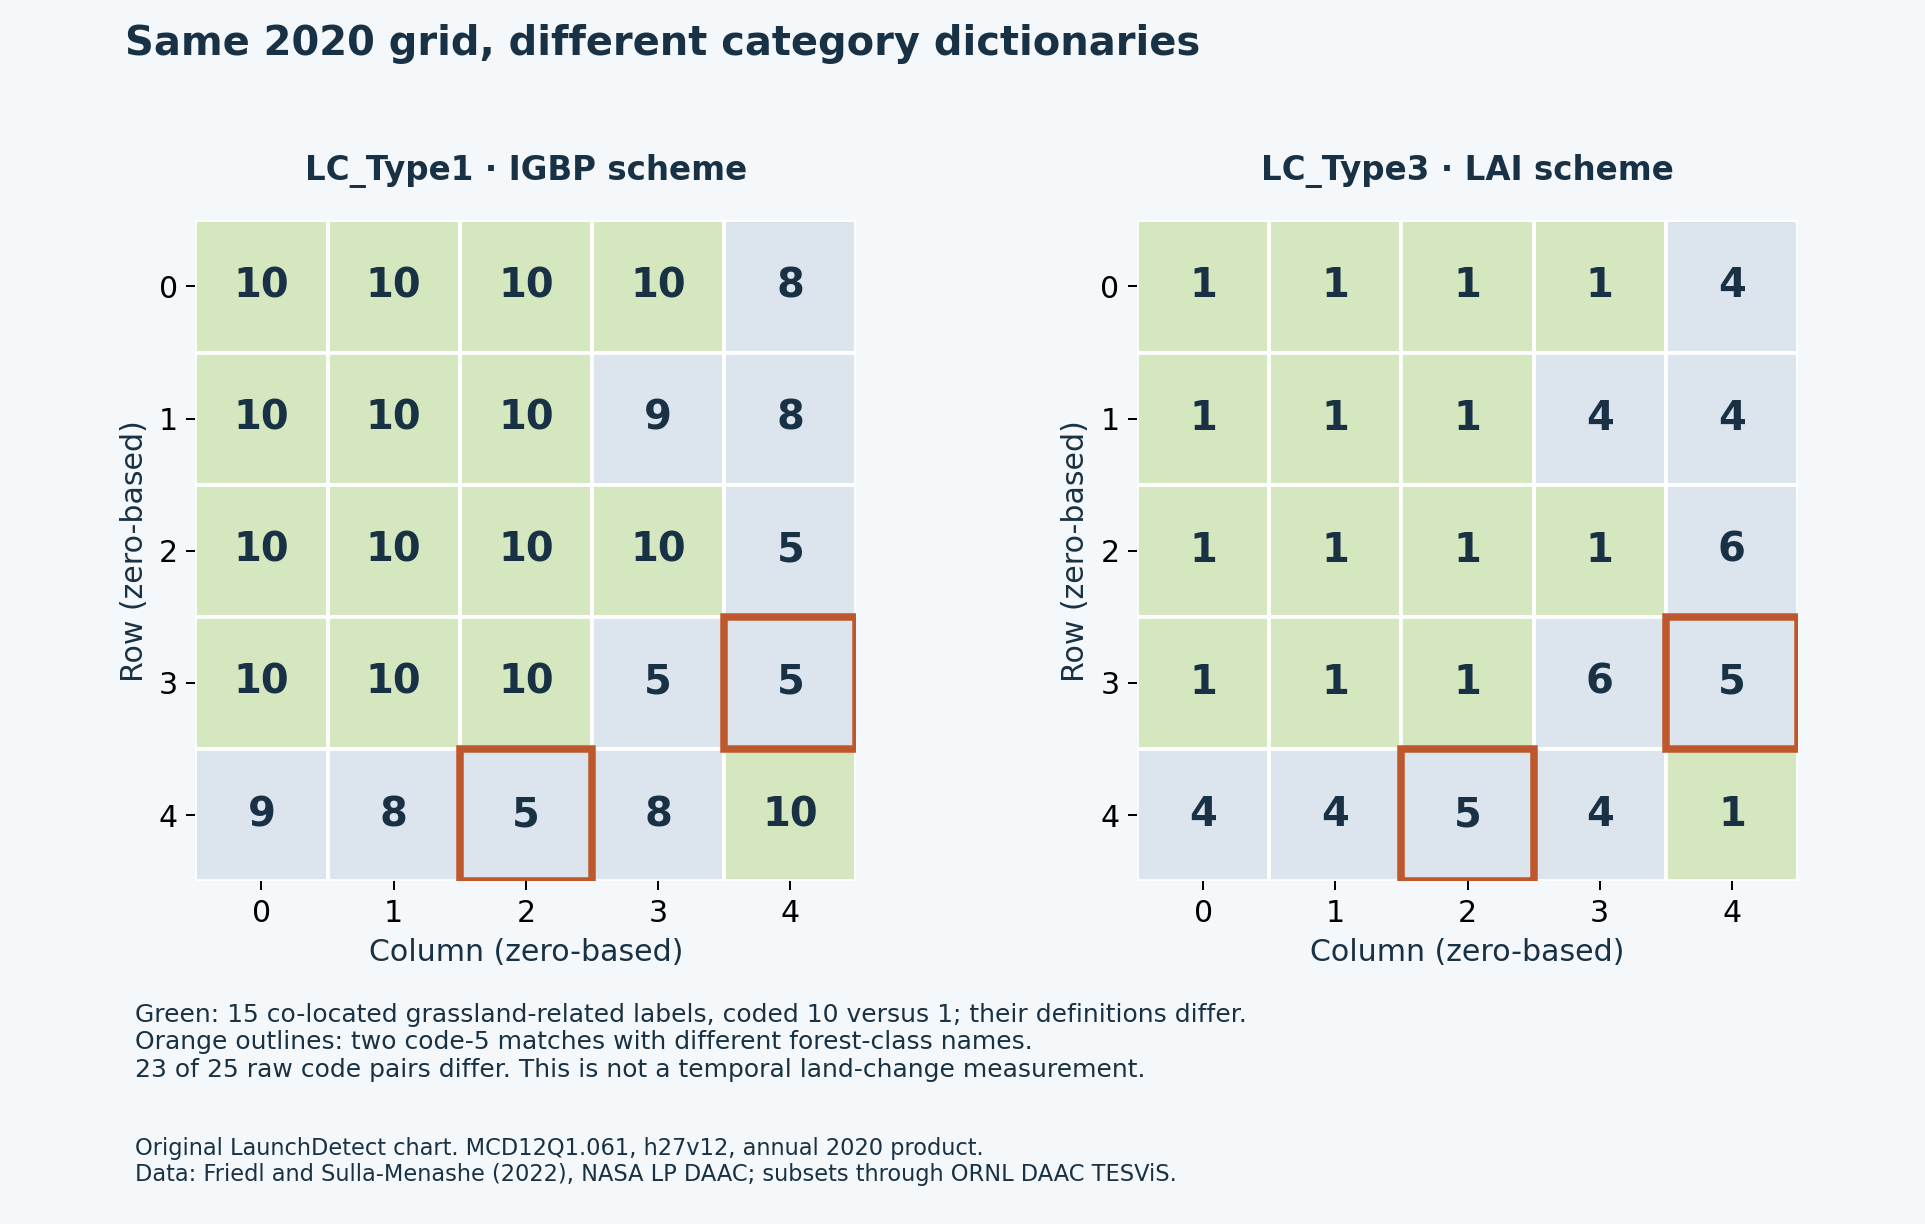
The complete five-pair tally
There are only five observed combinations in this subset. Decoding them with the scheme-specific legends exposes what a raw comparison conceals.
| LC_Type1 code and IGBP label | LC_Type3 code and LAI label | Cells | Same number? |
|---|---|---|---|
| 5: Mixed forests | 5: Evergreen broadleaf forests | 2 | Yes |
| 5: Mixed forests | 6: Deciduous broadleaf forests | 2 | No |
| 8: Woody savannas | 4: Savannas | 4 | No |
| 9: Savannas | 4: Savannas | 2 | No |
| 10: Grasslands | 1: Grasslands (including cereal croplands) | 15 | No |
A test that marks every unequal number would flag 15 + 4 + 2 + 2 = 23 cells, or 92%. That percentage is only a raw-code mismatch rate between dictionaries. It is not land-cover change, a misclassification rate or a measured accuracy disagreement.
The fifteen 10→1 pairs illustrate different numbers with related labels. IGBP code 10 is grasslands; LAI code 1 is also named grasslands, with a definition that explicitly includes cereal croplands. The labels are similar enough to expose the numerical trap, but the definitions are not identical enough to justify an automatic universal crosswalk.
The two 5→5 pairs illustrate the reverse trap. Numerical equality would hide a named-category difference: mixed forests in IGBP, evergreen broadleaf forests in LAI. They occur at zero-based row 3, column 4 and row 4, column 2. The orange outlines in the chart identify them in both grids.
The savanna rows show why a crosswalk needs definitions
Four cells pair IGBP woody savannas, code 8, with LAI savannas, code 4. Two pair IGBP savannas, code 9, with that same LAI code. The MCD12Q1 user guide defines different tree-cover groupings: IGBP separates 30–60% and 10–30% tree cover, while the LAI savanna class spans 10–60%.
That is a change in the category system’s partition of land cover. Replacing one number with another because both rows contain the word “savanna” would lose information. The forest entries need the same care. We have not built or validated a general conversion between these schemes.
QC = 0 does not turn this into ground truth
Every selected QC value is 0. In the MCD12Q1 quality legend, that status means classified land: the cell has a label and the water mask identifies it as land. It does not certify that the label is ecologically correct, provide a confidence percentage or validate a cross-scheme comparison.
This is the MCD12Q1 QC legend, not the ET_QC bit field from MOD16 evapotranspiration. Reusing a familiar zero-is-good shortcut across products would be another dictionary mistake. For this case, the check establishes that the arrays contain classified-land labels rather than showing that a numerical mismatch is a genuine change on the ground.
Inspect all 25 cells and repeat the tally
The table retains zero-based row and column coordinates so each cell can be matched to the figure. Both schemes come from the same 2020 granule. QC is 0 for every row.
| Row | Column | LC_Type1 | LC_Type3 | Codes differ? | QC |
|---|---|---|---|---|---|
| 0 | 0 | 10 | 1 | Yes | 0 |
| 0 | 1 | 10 | 1 | Yes | 0 |
| 0 | 2 | 10 | 1 | Yes | 0 |
| 0 | 3 | 10 | 1 | Yes | 0 |
| 0 | 4 | 8 | 4 | Yes | 0 |
| 1 | 0 | 10 | 1 | Yes | 0 |
| 1 | 1 | 10 | 1 | Yes | 0 |
| 1 | 2 | 10 | 1 | Yes | 0 |
| 1 | 3 | 9 | 4 | Yes | 0 |
| 1 | 4 | 8 | 4 | Yes | 0 |
| 2 | 0 | 10 | 1 | Yes | 0 |
| 2 | 1 | 10 | 1 | Yes | 0 |
| 2 | 2 | 10 | 1 | Yes | 0 |
| 2 | 3 | 10 | 1 | Yes | 0 |
| 2 | 4 | 5 | 6 | Yes | 0 |
| 3 | 0 | 10 | 1 | Yes | 0 |
| 3 | 1 | 10 | 1 | Yes | 0 |
| 3 | 2 | 10 | 1 | Yes | 0 |
| 3 | 3 | 5 | 6 | Yes | 0 |
| 3 | 4 | 5 | 5 | No | 0 |
| 4 | 0 | 9 | 4 | Yes | 0 |
| 4 | 1 | 8 | 4 | Yes | 0 |
| 4 | 2 | 5 | 5 | No | 0 |
| 4 | 3 | 8 | 4 | Yes | 0 |
| 4 | 4 | 10 | 1 | Yes | 0 |
Download the complete cell audit with labels (CSV) and five-pair tally (CSV). Count rows where LC_Type1 differs from LC_Type3 to recover 23, and count the (10, 1) and (5, 5) combinations to recover 15 and 2. The original three subset responses and exact granule record are linked below.
A safer comparison starts with the scheme name
- Record more than the product name. Keep the collection version, band, scheme, annual period, grid and processing identity with every exported category raster.
- Choose one intended classification scheme. For a same-scheme comparison, verify the applicable legend rather than assuming every MCD12Q1 band uses the same codes.
- Decode before combining schemes. If the task truly requires a crosswalk, define the target categories and document how each source definition maps to them, including information lost or left unresolved.
- Treat category codes as labels. Subtracting 1 from 10 does not produce nine units of land-cover change. A numerical average or linear interpolation of these labels has no land-cover meaning.
- Separate schema checks from validation. Product QA and a sensible dictionary join are necessary checks; independent evidence is still needed to assess classification correctness or a real temporal transition.
The small sample’s lesson is concrete: the scheme travels with the number. In this file, different numbers sometimes describe related classes, and the same number can name different classes. Keeping the dictionary attached prevents a comparison from answering a question the data never posed.
Sources and attribution
- MCD12Q1.061 product and citation: annual land-cover product and classification schemes.
- MCD12Q1 user guide, Tables 3, 5 and 11: IGBP, LAI and QA definitions, cross-checked against the Version 6.1 catalog legends.
- LC_Type1 subset, LC_Type3 subset and QC subset: original retained arrays.
- NASA CMR granule record: version, processing identity and 2020 annual coverage.
- LP DAAC data-citation FAQ: reuse terms.
Sources checked 4 October 2026. This is an original categorical-data audit and graphic, with no copied satellite image, basemap or source-page figure.
The ORNL subset links are API endpoints: request them with the Accept: application/json header. The downloadable CSVs in this article provide the reviewed values for reading without an API client.