Launch Watch · Launch Watch · Evidence study
Published
Mumbai’s 2024 sunlight: a larger diffuse share can mean less diffuse energy
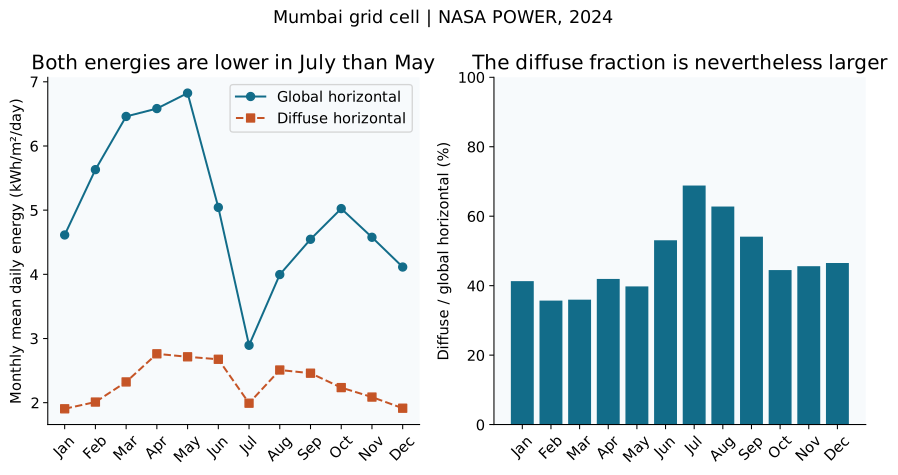
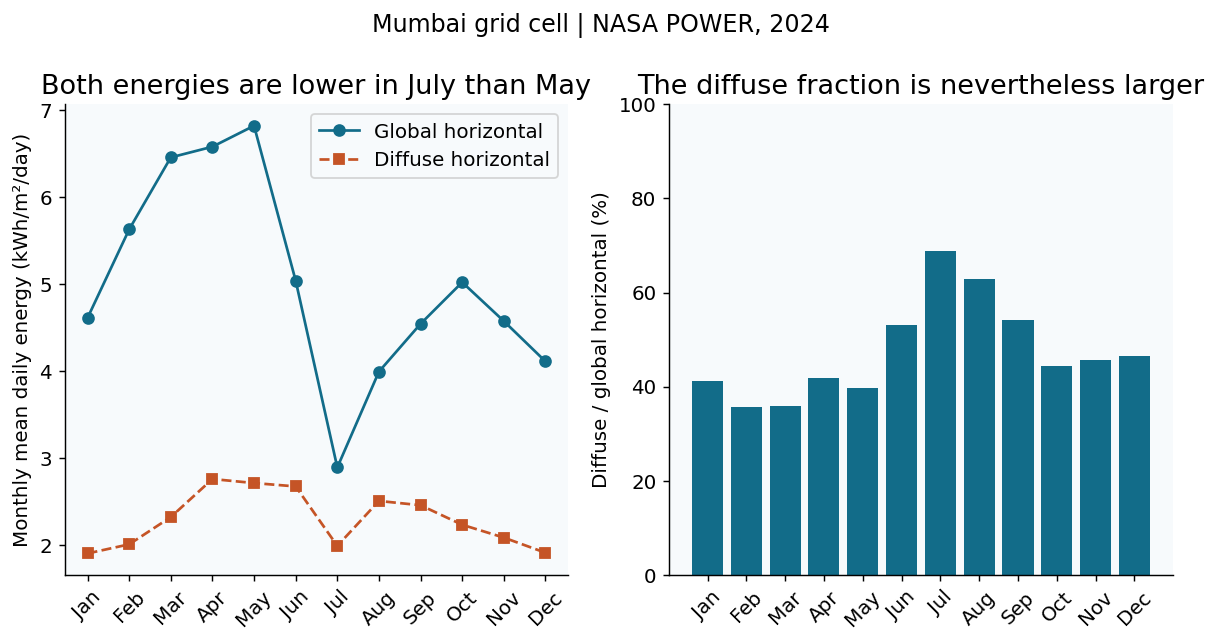
At NASA POWER’s Mumbai grid location, diffuse sunlight’s share rises from 39.78% in May to 68.83% in July 2024, even as diffuse energy falls.
Diffuse sunlight supplied a larger share of Mumbai’s estimated solar energy in July 2024 than in May. Yet the estimated diffuse energy itself was lower. NASA POWER’s monthly values put the diffuse share at 39.78% in May and 68.83% in July, while diffuse-horizontal energy fell by 26.62%.
The explanation is in the denominator. Global-horizontal energy fell faster, by 57.59%. A smaller component can occupy a larger fraction of a total that shrinks more sharply. Keeping energy and share on separate panels makes that easy to see.
Open full-size figure · Download PNG figure
Start with the two energy values
At the requested grid location, May’s monthly mean daily global-horizontal energy is 6.8242 kWh/m²/day, of which 2.7149 is diffuse horizontal. July’s corresponding values are 2.8944 and 1.9922 kWh/m²/day.
Dividing diffuse horizontal by global horizontal and multiplying by 100 gives each month’s share. July’s 68.83% is the highest share in this 12-month record. It is not the month with the most diffuse energy: April holds that position at 2.7612 kWh/m²/day. May has the highest global-horizontal energy.
| Month | Global horizontal | Diffuse horizontal | Diffuse share (%) |
|---|---|---|---|
| January | 4.6133 | 1.9051 | 41.30 |
| February | 5.6314 | 2.0100 | 35.69 |
| March | 6.4601 | 2.3234 | 35.97 |
| April | 6.5830 | 2.7612 | 41.94 |
| May | 6.8242 | 2.7149 | 39.78 |
| June | 5.0429 | 2.6762 | 53.07 |
| July | 2.8944 | 1.9922 | 68.83 |
| August | 3.9962 | 2.5090 | 62.78 |
| September | 4.5461 | 2.4598 | 54.11 |
| October | 5.0242 | 2.2351 | 44.49 |
| November | 4.5773 | 2.0875 | 45.61 |
| December | 4.1138 | 1.9135 | 46.51 |
Percentages need their denominators
The change from 39.78% to 68.83% is an increase of 29.05 percentage points. The diffuse-energy change of −26.62% uses May’s diffuse energy as its denominator. These are different calculations with different units, so they should not be placed under a single unlabeled “change” heading.
For an energy question, retain kWh/m²/day. For a composition question, retain the dimensionless share and say which total it divides. A high share alone cannot show that a surface receives a large quantity of energy.
Keep the receiving plane consistent
The NASA POWER energy-flux documentation distinguishes horizontal-plane quantities from direct-normal quantities. Diffuse-horizontal and global-horizontal energy refer to a horizontal receiving surface. Direct normal refers to a plane facing the direct solar beam.
The companion CSV preserves the requested direct-normal values, but this article does not add monthly direct-normal energy directly to diffuse-horizontal energy to reconstruct the global-horizontal total. That would combine values defined for different orientations. The two horizontal fields already supply the numerator and denominator needed for this comparison.
The request and calculation
We requested NASA POWER’s monthly renewable-energy data at 19.0760° N, 72.8777° E for 2024. The response identifies API version 2.10.0 and the SYN1DEG and POWER source tags, with local solar time. The three requested parameters are ALLSKY_SFC_SW_DWN, ALLSKY_SFC_SW_DIFF and ALLSKY_SFC_SW_DNI.
We retain only keys 202401 through 202412. The annual aggregate key 202413 is excluded from the monthly series. None of the twelve global/diffuse pairs is missing. For each month, the plotted share is 100 times the diffuse-horizontal value divided by the global-horizontal value.
This is a ratio of monthly mean daily energies. It is not an average of instantaneous diffuse fractions. Those aggregations would answer different questions and should not be substituted without the underlying time-resolved data.
How far the example travels
NASA POWER supplies satellite-informed gridded estimates. This sample is not a rooftop sensor record or a site-specific prediction of electricity production. It does not include the design and operating characteristics needed to forecast a solar installation’s output.
One location and one year also cannot establish a monsoon trend or isolate cloud effects from aerosols and solar geometry. The defensible finding is the arithmetic relationship visible here: July’s diffuse component is smaller in energy terms but larger as a fraction of the global-horizontal total. The separate Hawaii seasonal-grid comparison illustrates why the location and comparison being made should stay attached to any POWER result.
Sources and data
Source snapshots were retrieved on 6 October 2026. The observation dates and product versions are stated above; retrieval does not make a historical record current.
- NASA POWER monthly solar data at Mumbai (API v2.10.0; sources SYN1DEG/POWER; 2024)
- NASA POWER energy-flux methodology (Satellite-based radiation and horizontal/normal geometry)
- NASA POWER derived parameters (CERES SYN1deg methodology)