Launch Watch · Current evidence
Published
Four NOAA CO₂ stations: why August 2020 changed the order
Compare 48 monthly surface-flask CO₂ values from Utqiaġvik, Mauna Loa, American Samoa and South Pole, with a downloadable same-product dataset.
In August 2020, the northernmost station in this four-site comparison had the lowest monthly CO₂ value. Utqiaġvik, Alaska, listed under station code BRW, was at 402.95 parts per million. Mauna Loa was at 412.49, American Samoa at 411.96 and South Pole at 410.68 ppm.
Earlier that year, BRW reached 420.87 ppm in April. The changing order is a useful reminder to keep the month attached to a station comparison instead of treating a location’s value as a fixed place in a ranking.
We compared all twelve 2020 months from the same NOAA Global Monitoring Laboratory surface-flask product at all four stations: 48 processed monthly means in total. These monthly values are derived from fitted curves based on retained flask measurements. They are not individual air samples or simple averages of every raw reading collected during a month.
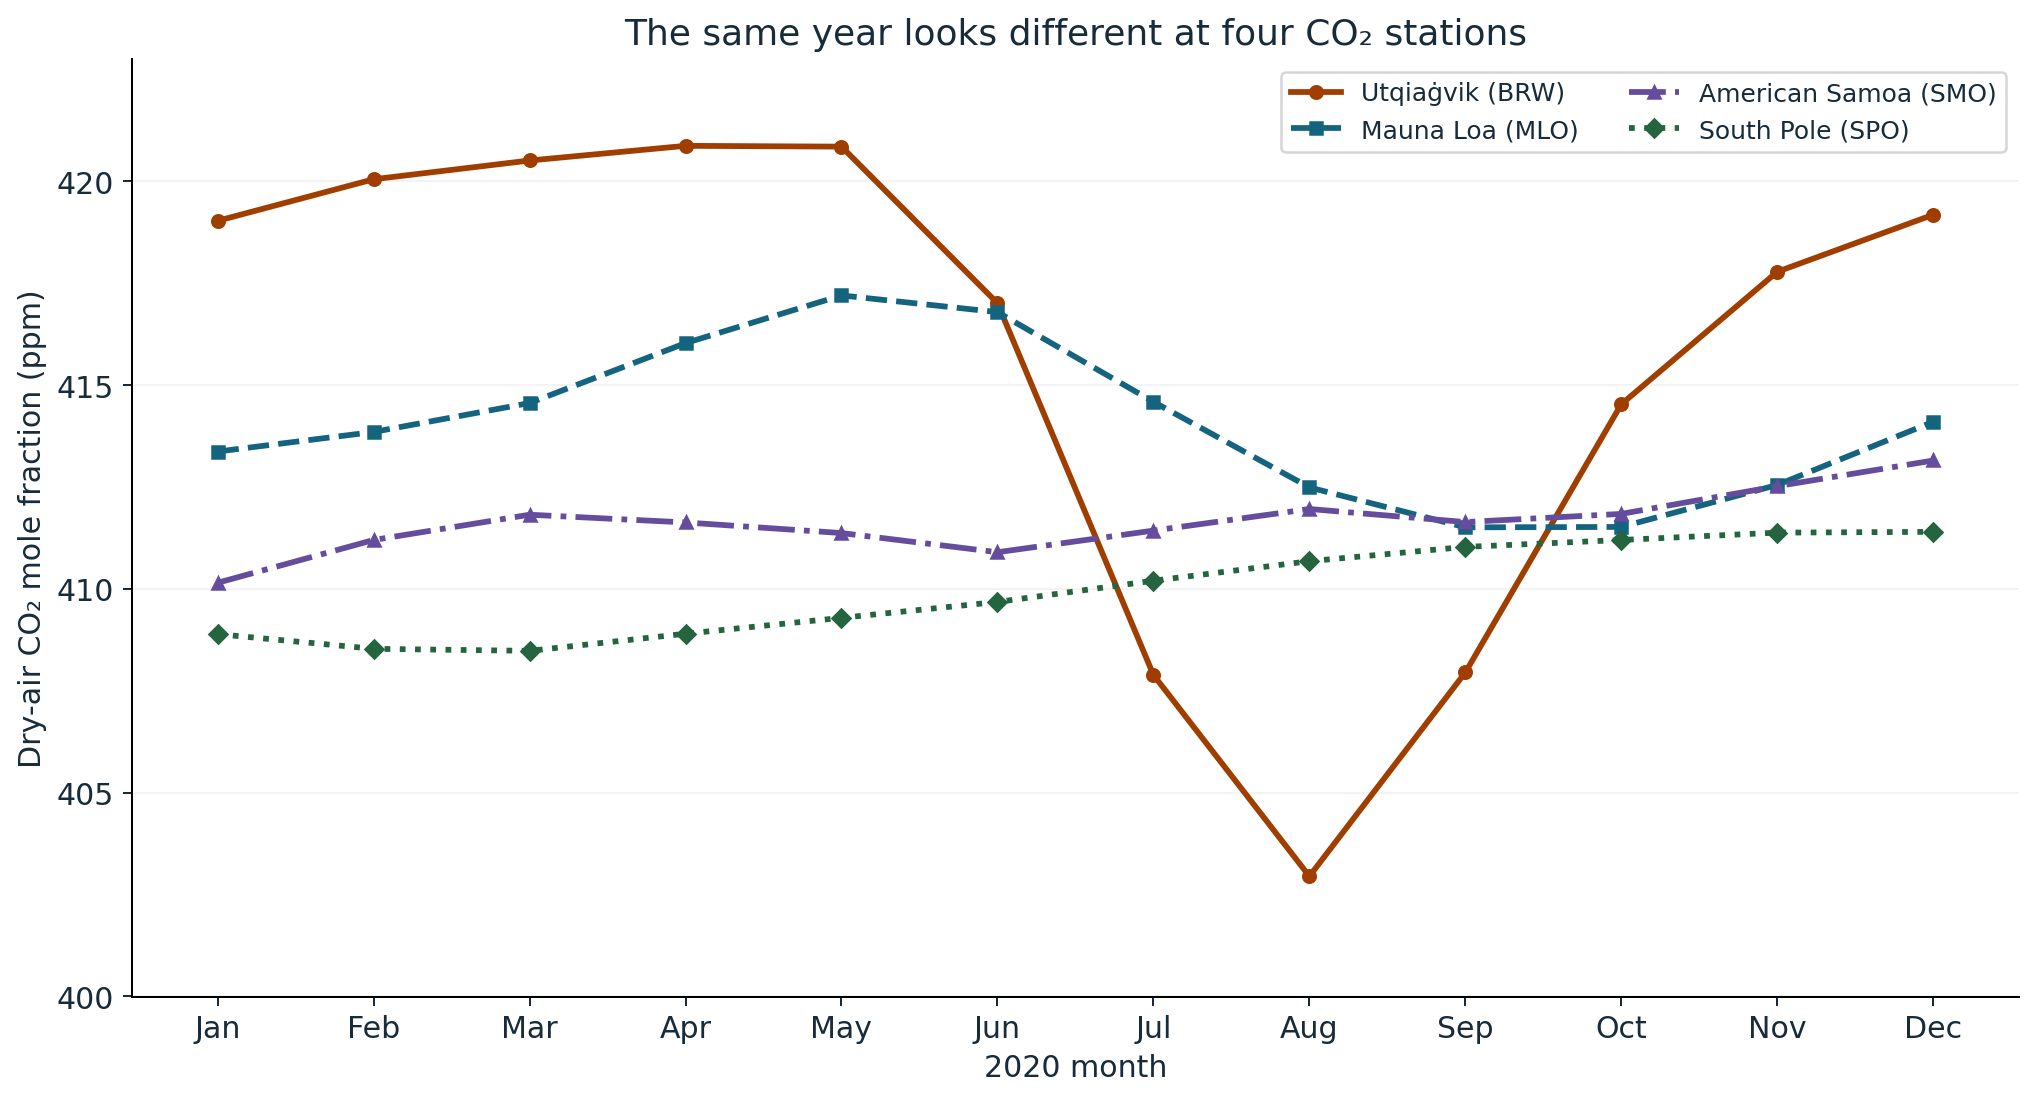
Compare the size and timing of the monthly ranges
| Station | Highest monthly value | Lowest monthly value | Within-year range |
|---|---|---|---|
| Utqiaġvik (BRW) | 420.87 ppm, April | 402.95 ppm, August | 17.92 ppm |
| Mauna Loa (MLO) | 417.20 ppm, May | 411.51 ppm, September | 5.69 ppm |
| American Samoa (SMO) | 413.15 ppm, December | 410.15 ppm, January | 3.00 ppm |
| South Pole (SPO) | 411.40 ppm, December | 408.48 ppm, March | 2.92 ppm |
BRW’s range is 420.87 − 402.95 = 17.92 ppm. Mauna Loa’s is 417.20 − 411.51 = 5.69 ppm. The differences are easy to check because every series uses the same unit, the same year and the same monthly product family.
The extrema occur in different months. Comparing each station’s maximum would answer “How high did its monthly series get during 2020?” Comparing the August row answers “How did these four processed monthly values compare at the same time?” Mixing those questions would produce a table of numbers that are individually valid but temporally mismatched.
We call the last column a within-year range. It is not a detrended seasonal amplitude. A maximum and minimum drawn from one calendar year can reflect background growth as well as the seasonal cycle. The December maxima at American Samoa and South Pole make that naming distinction especially useful.
What a monthly surface-flask mean contains
The dataset README describes air collected in flasks and sent to the laboratory for analysis. It also explains the monthly processing: retained results sharing a sampling time are averaged, a smooth curve is fitted, values are taken from that curve at weekly intervals and those weekly values are averaged within each month. Flagged data are excluded from the curve fit.
That processing is part of the product, rather than a smoothing operation added for this article. Our chart connects the published monthly values directly and our CSV preserves them. Twelve available monthly points show that the monthly product covers the full selected year; they do not demonstrate continuous minute-by-minute sampling or twelve identical sampling schedules.
The files identify the quantity as dry-air CO₂ mole fraction in ppm, on the WMO X2019 scale. NOAA’s measurement explanation describes dry-air mole fraction as the number of CO₂ molecules relative to air molecules after excluding water vapour. A value around 410 ppm means roughly 410 CO₂ molecules per million dry-air molecules.
We deliberately use the surface-flask monthly file at Mauna Loa as well as the other three stations. Substituting a familiar continuous-observatory trend download for just that station would change the product mix. A shared station name does not guarantee identical sampling or processing.
August makes the changing station order visible
| Station | CO₂, dry-air ppm |
|---|---|
| Utqiaġvik (BRW) | 402.95 |
| Mauna Loa (MLO) | 412.49 |
| American Samoa (SMO) | 411.96 |
| South Pole (SPO) | 410.68 |
The BRW–MLO difference in this row is 402.95 − 412.49 = −9.54 ppm. This is enough to reject a simple rule that the northernmost of these stations must always have the highest monthly value. It does not identify which source, sink or transport process caused that particular difference.
The four curves are descriptive evidence. We do not attribute their separation to latitude alone, a local emissions source or the 2020 lockdowns. Those questions would require additional observations, a clear counterfactual and an appropriate atmospheric analysis. A station-to-station subtraction is not an emissions inventory.
Keep the measurement’s scale with the number
These are station-based, processed surface-flask values. They are not a population exposure survey, a global mean or a satellite column product. A value from a named station and month should retain those labels whenever it is quoted.
The distinction also matters when comparing this chart with a map. A map may represent a different vertical sampling, time average or spatial aggregation. Check the product definition and units before placing it on the same axis. Sharing the chemical label “CO₂” does not make two measurements interchangeable.
Rebuild the 48-point comparison
The primary monthly files are BRW, MLO, SMO and SPO. Download our 48-row extract for a spreadsheet-ready copy of the selected year.
- Skip source lines beginning with a hash sign and read station code, year, month and value.
- Select 2020 and confirm exactly one valid value for each month from 1 to 12 at every station.
- Keep the four station series on one shared ppm axis. Distinguish them with labels and line patterns as well as colour.
- Find each series’ largest and smallest monthly values, retaining their months, then subtract minimum from maximum.
- For a simultaneous comparison, select the same month at all four stations before calculating differences.
Data citation: Lan et al. (2026), Atmospheric Carbon Dioxide Dry Air Mole Fractions from the NOAA GML Global Greenhouse Gas Reference Network, Carbon Cycle Cooperative Global Air Sampling Network: 1967–Present, version 2026-07-17, dataset DOI. Accessed 5 October 2026. The README licenses the data under CC0 1.0 and warns that recalibration or other scientific corrections can revise past values. This AI-assisted analysis and original graphics are LaunchDetect work, not an official NOAA product.