Launch Watch · Launch Watch · Evidence study
Published
Less June snow, more October snow: why the month changes the answer
NOAA snow-extent data show a 31.78% smaller June mean but a 15.97% larger October mean when 2015–2024 is compared with 1981–2010.
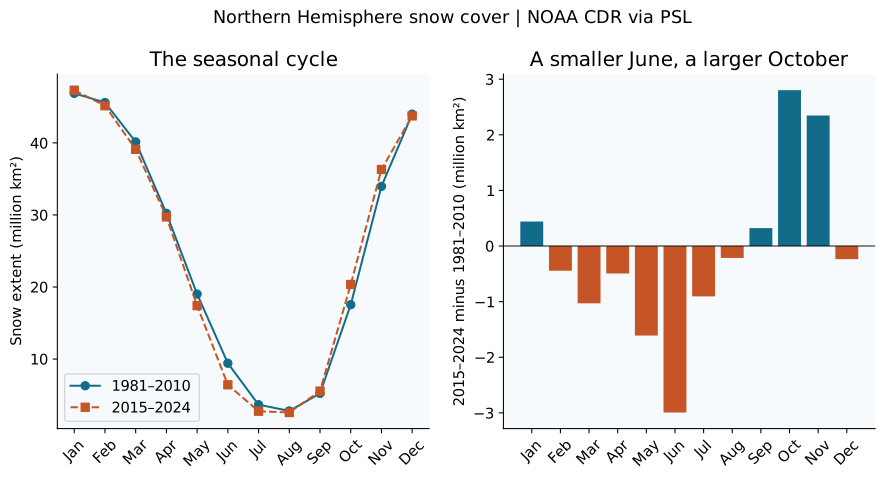
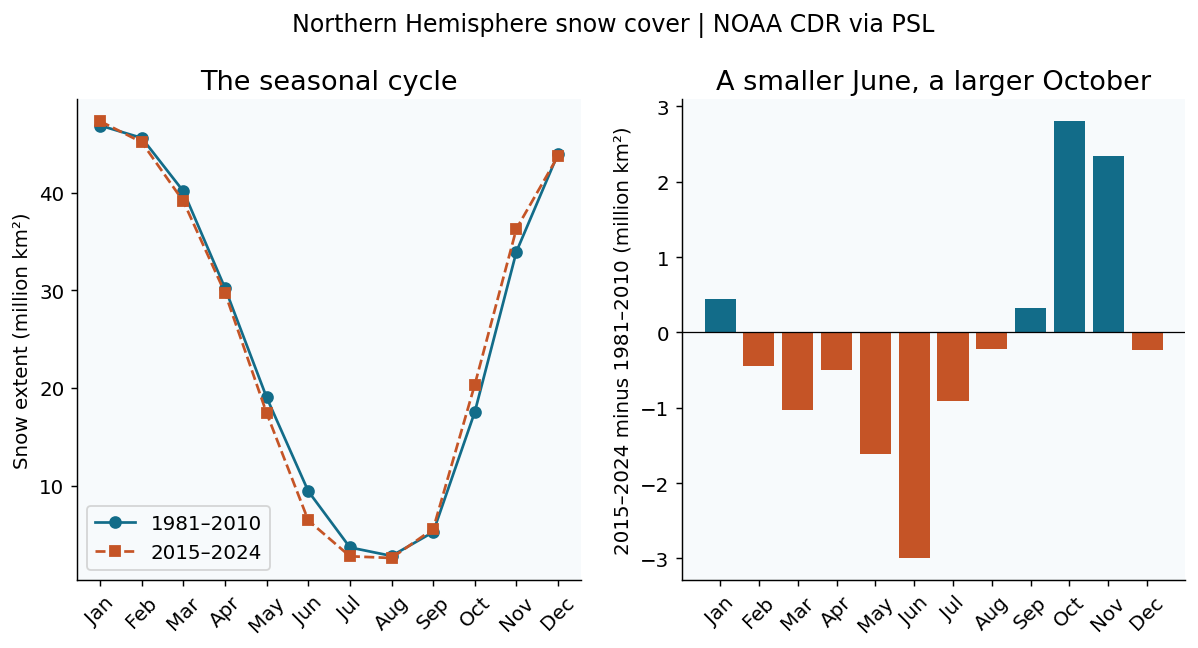
Ask whether the Northern Hemisphere has more or less snow cover, and the month changes the answer. In NOAA’s monthly extent record, June’s mean is 31.78% smaller in 2015–2024 than in 1981–2010. October’s mean is 15.97% larger across the same comparison periods.
These results do not cancel each other out. They describe different parts of the annual snow-cover cycle. Keeping all twelve months separate reveals the seasonal contrast that a single “snowier” or “less snowy” label would hide.
Open full-size figure · Download PNG figure
What the area measurement means
The NOAA PSL series reports Northern Hemisphere snow-cover extent in millions of square kilometres, based on the NOAA Snow Cover Extent Climate Data Record. Extent describes geographic snow-covered area. It does not measure snow depth, snowfall, snow-water equivalent or the volume of water stored in the snowpack.
A larger October footprint can therefore coexist with a smaller June footprint. Neither number alone tells us how much snow fell during a particular storm, or how much meltwater a river basin will receive.
| Month | 1981–2010 mean | 2015–2024 mean | Change (million km²) | Change (%) |
|---|---|---|---|---|
| January | 46.866 | 47.307 | +0.441 | +0.94 |
| February | 45.594 | 45.150 | -0.444 | -0.97 |
| March | 40.129 | 39.099 | -1.030 | -2.57 |
| April | 30.215 | 29.721 | -0.494 | -1.63 |
| May | 19.019 | 17.409 | -1.610 | -8.46 |
| June | 9.419 | 6.425 | -2.994 | -31.78 |
| July | 3.664 | 2.759 | -0.905 | -24.71 |
| August | 2.796 | 2.582 | -0.214 | -7.65 |
| September | 5.235 | 5.557 | +0.322 | +6.15 |
| October | 17.544 | 20.347 | +2.803 | +15.97 |
| November | 33.959 | 36.306 | +2.347 | +6.91 |
| December | 43.981 | 43.745 | -0.236 | -0.54 |
Read June and October side by side
The baseline June mean is 9.418667 million square kilometres. The 2015–2024 mean is 6.425000 million. Subtracting baseline from recent gives −2.993667 million square kilometres; dividing that difference by the baseline gives −31.78%.
For October, the corresponding means are 17.544333 and 20.347000 million square kilometres. The increase is 2.802667 million square kilometres, or 15.97%. January changes much less in percentage terms: from 46.866333 to 47.307000 million square kilometres, an increase of 0.94%.
The chart’s left panel places both monthly curves on the same axes. The right panel subtracts the baseline month from the same recent month. This is why each bar has a clear interpretation: June is compared with June, October with October, and so on.
The calculation, with the sample sizes visible
We parse NOAA PSL’s standard-format monthly data file and exclude its −9999 missing-value marker. For each calendar month, we take the unweighted mean over 1981–2010 and separately over 2015–2024. Each baseline mean has 30 valid yearly values; each recent mean has ten.
The difference is recent mean minus baseline mean. The percentage difference uses the baseline as its denominator. The table rounds displayed area values to three decimal places and percentages to two; the CSV retains the calculated values for reuse.
The selected periods deliberately exclude 2025–2026 values. Using complete, explicitly named intervals avoids letting a partial current year change the seasonal sample. It also makes the comparison reproducible rather than leaving “recent” undefined.
What would require a different analysis
This is a descriptive comparison of two averaging periods of different lengths. It does not test statistical significance, fit a trend or attribute the differences to a particular cause. A significance or attribution claim needs the relevant additional analysis, including attention to variability and how the observations were produced.
The NOAA CDR documentation notes a source-frequency transition: weekly visible-satellite analysis before June 1999, followed by daily analysis. That methodological history belongs beside long-term comparisons, even when the arithmetic itself is simple.
The geographic scale matters too. Hemisphere-wide means do not establish a trend at one ski area, city or watershed, and neither month predicts the coming winter. For local energy measurements following one storm, the Sioux Falls reflected-solar-energy study asks a different question.
Put the month and period in the sentence
A supported summary is: “Northern Hemisphere mean June snow extent was 31.78% lower in 2015–2024 than in 1981–2010, while October’s mean was 15.97% higher.” It names the quantity, season, periods and direction. Those details are what make the two findings useful rather than contradictory.
Dataset credit: Robinson, Estilow and NOAA CDR Program (2012), NOAA Climate Data Record of Northern Hemisphere Snow Cover Extent, Version 1, DOI 10.7289/V5N014G9. The figures and comparison calculations are original LaunchDetect work.
Sources and data
Source snapshots were retrieved on 6 October 2026. The observation dates and product versions are stated above; retrieval does not make a historical record current.
- NOAA PSL monthly Northern Hemisphere snow extent (NOAA Northern Hemisphere Snow Cover Extent CDR v01r01/Version 1; DOI 10.7289/V5N014G9)
- NOAA PSL snow-series metadata (Units million km² and official dataset citation)
- NOAA NCEI Snow Cover Extent CDR description (Weekly/daily source-method transition)
- NOAA CDR Snow Cover Use Agreement (Open data, unrestricted use; proper citation encouraged)
Download B452-seasonal-comparison.csv (CSV) · Download B452-snow-monthly.csv (CSV)