Launch Watch · Current evidence
Published
Phoenix at night: what a MODIS surface pixel measured
Inspect 20 day/night surface-temperature composites from 2023, with local-solar sampling times, decoded quality flags and limits on air-temperature claims.
A single MODIS grid cell in central Phoenix stayed warm in the nighttime satellite record during the selected summer-2023 window. Across ten eight-day composites beginning 26 June through 6 September, the nighttime land-surface estimates range from 29.73°C to 37.97°C. Their median is 33.61°C.
The corresponding daytime surface estimates range from 46.65°C to 52.77°C, with a median of 50.01°C. These values describe the surface seen in available clear-sky retrievals at the satellite’s sampling times. They should not be read as Phoenix’s official daily air-temperature highs and lows.
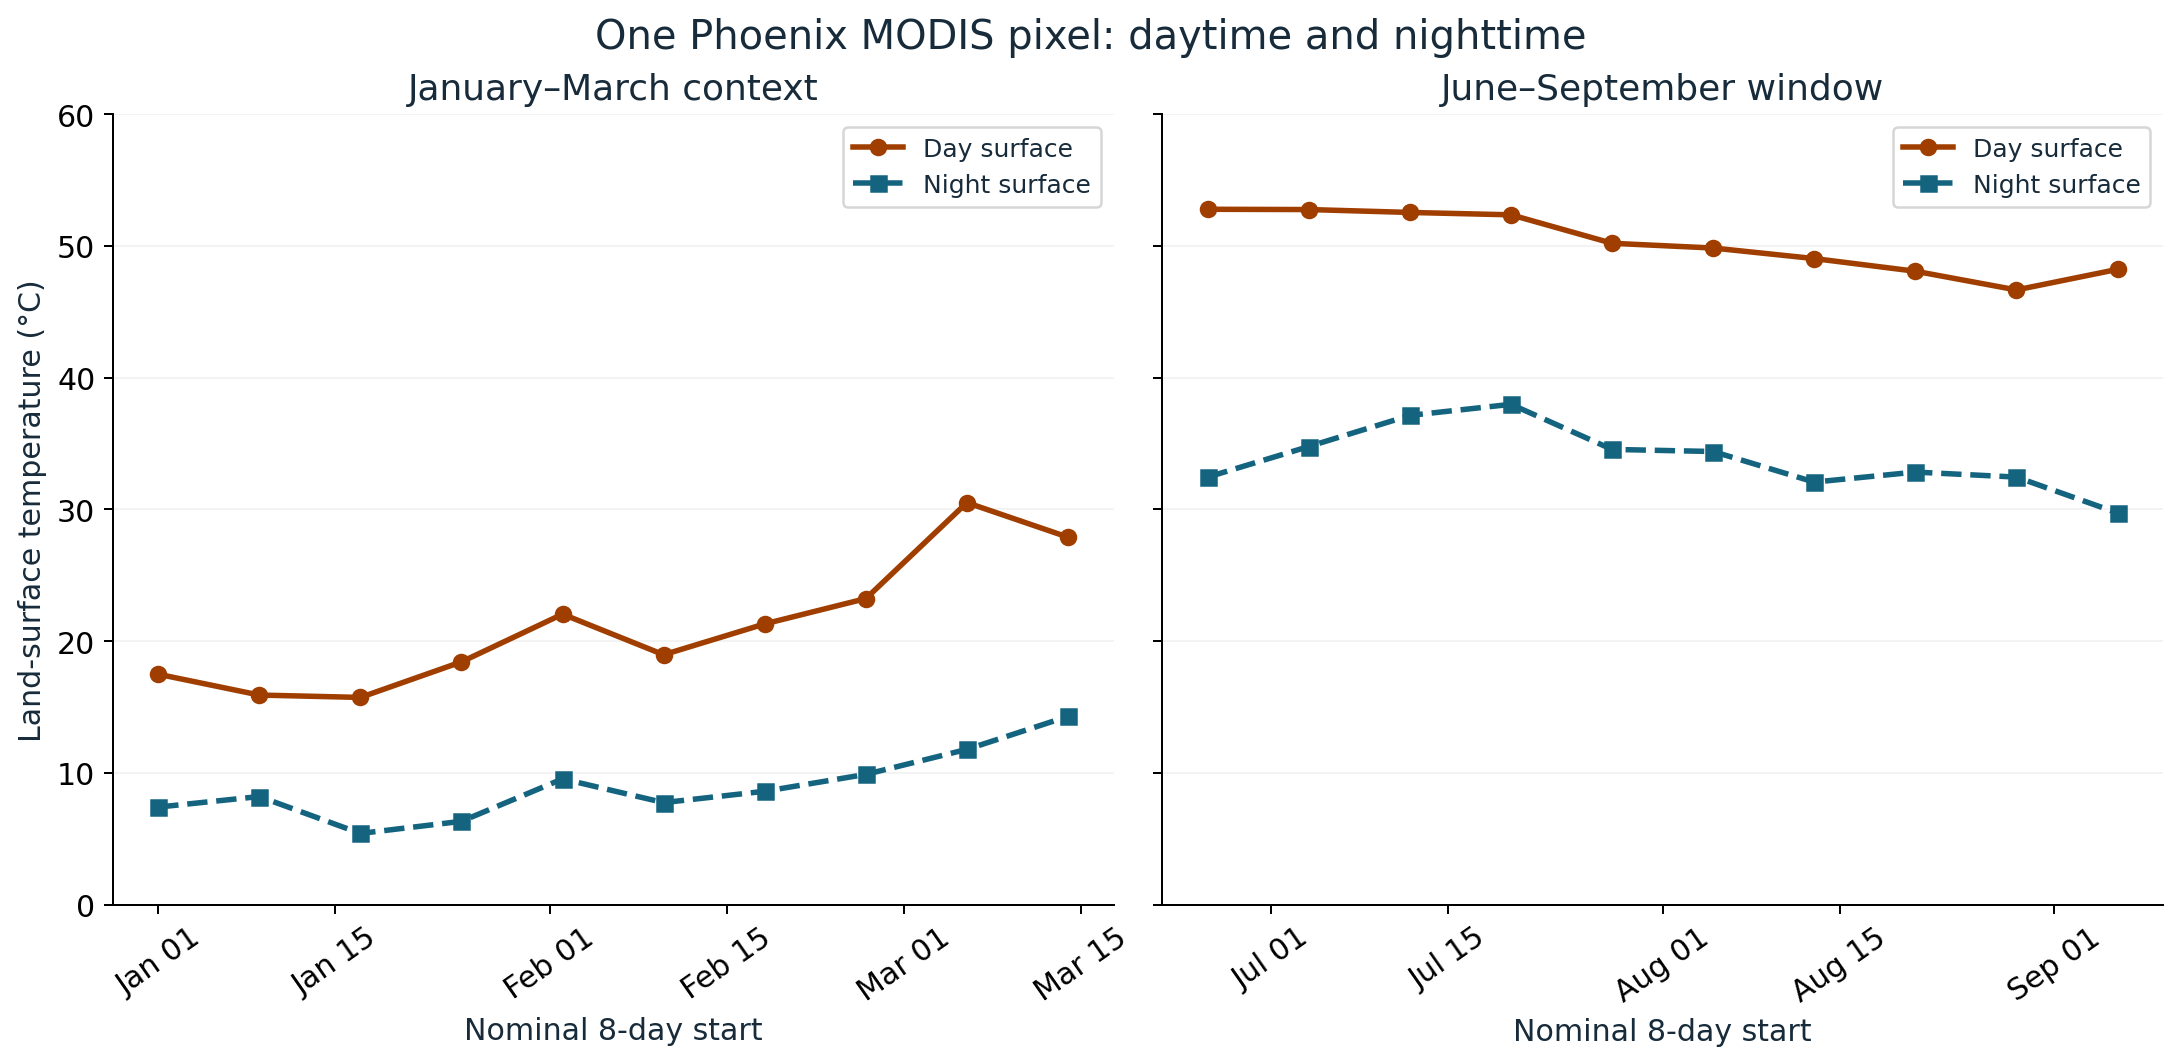
What the two selected windows contain
| Statistic | January–March context | June–September window |
|---|---|---|
| Median daytime surface temperature | 20.14°C | 50.01°C |
| Median nighttime surface temperature | 8.41°C | 33.61°C |
| Median paired day-minus-night difference | 12.30°C | 15.54°C |
| Daytime range | 15.73–30.51°C | 46.65–52.77°C |
| Nighttime range | 5.41–14.29°C | 29.73–37.97°C |
The request coordinate is 33.4484°N, 112.0740°W. The returned extract has one row, one column and a grid spacing of approximately 926.63 metres. It represents one cell in the MODIS product’s nominal one-kilometre grid, not all of Phoenix or a particular person’s surroundings.
The cold-season context uses composites beginning 1 January through 14 March. The warm-season window begins 26 June and ends with the composite starting 6 September. These are deliberately named windows rather than complete meteorological seasons or climatologies. Each date marks a composite’s start, not a single instantaneous city-wide temperature.
Daytime and nighttime refer to sampling windows
The MOD11A2 product description explains that the eight-day values average the corresponding daily land-surface-temperature retrievals. The MOD11 user guide also documents observation times and quality fields. Available clear-sky observations do not provide complete sampling through cloudy periods.
In the warm-window extract, mean daytime view times span 10.2–10.6 local-solar hours. The nighttime view times span 21.3–22.0 local-solar hours. Those are product local-solar times, not Arizona civil clock times. In particular, a nighttime sample does not establish the coolest temperature before dawn.
The surface measurement is another important boundary. It is not two-metre air temperature, heat index or a health-exposure measurement. A point in this record cannot replace an official weather-station reading simply because both are expressed in degrees Celsius.
Every retained point needs a quality caveat
All forty day/night values in the two windows have mandatory quality-assurance category 1. The user guide describes that category as an LST value produced with “other quality” and recommends examining the detailed flags. None of these values is being presented as mandatory-QA category 0, the top summary category.
| QC byte | Where it occurs | Reported LST-error category |
|---|---|---|
| 17 | Some summer nighttime entries | Average error ≤1 K |
| 81 | All summer daytime and most other entries | Average error ≤2 K |
| 145 | 1 January daytime entry | Average error ≤3 K |
In each of those patterns, the detailed data-quality bits are 0 and the emissivity-error category is 1. The latter corresponds to the documented average emissivity-error category of at most 0.02. These fields add context to the mandatory category; they do not erase it.
The error categories are reported retrieval-quality categories, not statistical confidence intervals to place around our medians. We do not use them to rank small differences between nearby entries or claim hundredth-degree physical accuracy. Two decimal places preserve the arithmetic of the scaled source values.
Why the median difference is 15.54°C
Subtracting the two summer medians gives 50.01 − 33.61 = 16.40°C. That differs from the median paired difference of 15.54°C because the operations answer different questions.
To obtain 15.54°C, subtract each nighttime composite value from its matching daytime value, producing ten differences, and take the median of those ten differences. Taking the daytime median and nighttime median separately does not preserve the same pairings. Both calculations are reproducible; a label should state which one was used.
Even the paired result is a difference between two composite sampling streams. It is not a measured daily temperature range. The day and night estimates may summarize different available observations within the same eight-day period, and neither stream continuously follows a full 24-hour cycle.
Reproduce the extract without guessing the units
Download the twenty-composite CSV. Each row retains raw temperature integers, Celsius values, raw QC bytes, decoded flag categories, local-solar view times and the paired difference. The summary table above supplies the main result without an interactive chart.
Use the ORNL DAAC subset service with MOD11A2, the stated coordinate and zero spatial half-widths. The warm request spans A2023177–A2023249; the context request spans A2023001–A2023073. Check that each response contains a single cell and ten nominal start dates.
The temperature conversion is raw value × 0.02 kelvin, then subtract 273.15 to express Celsius. View-time integers use a 0.1-hour scale. Keep missing-value handling separate from temperature conversion and decode the QC bits before deciding which values to retain. The public CSV makes our decision to retain produced-but-other-quality values explicit.
The responses do not expose a collection-version field. We use the current V061 catalog and the user guide as product documentation while identifying the numerical record as the dated service extract. The result shows one pixel’s clear-sky surface-temperature pattern; it does not isolate an urban-heat-island effect, identify which surface material caused the values or estimate personal heat risk.
Source credit: NASA MODIS MOD11A2 and ORNL DAAC’s TESViS REST service, accessed 5 October 2026. This AI-assisted article and original graphics are LaunchDetect work. NASA and ORNL have not reviewed or endorsed the interpretation.