Launch Watch · Launch Watch · Evidence study
Published
Before calling a MODIS tree-cover drop deforestation, check the 2024 processing break
A Rondônia MOD44B window drops 8.13 tree-cover percentage points in 2024, alongside input-quality and documented runtime changes. Attribution needs more evidence.
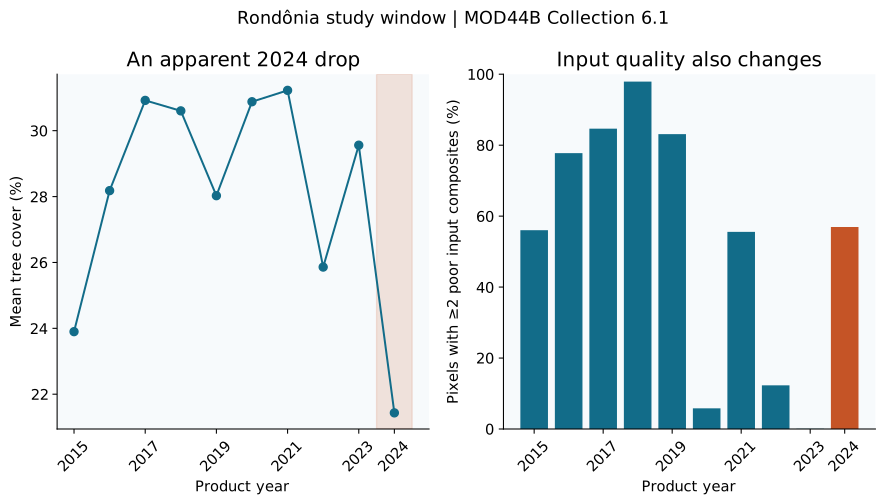
Mean tree cover in one MODIS window in Rondônia drops from 29.56% in the 2023 product to 21.43% in 2024. Before describing that 8.13-percentage-point change as deforestation, there are two comparability checks to make: the quality of the inputs changes sharply, and NASA documents a processing-runtime transition beginning with 2024.
Those checks do not explain away the entire drop. They establish why this product difference alone cannot allocate the change among actual land-cover change, input quality and processing effects.
Open full-size figure · Download PNG figure
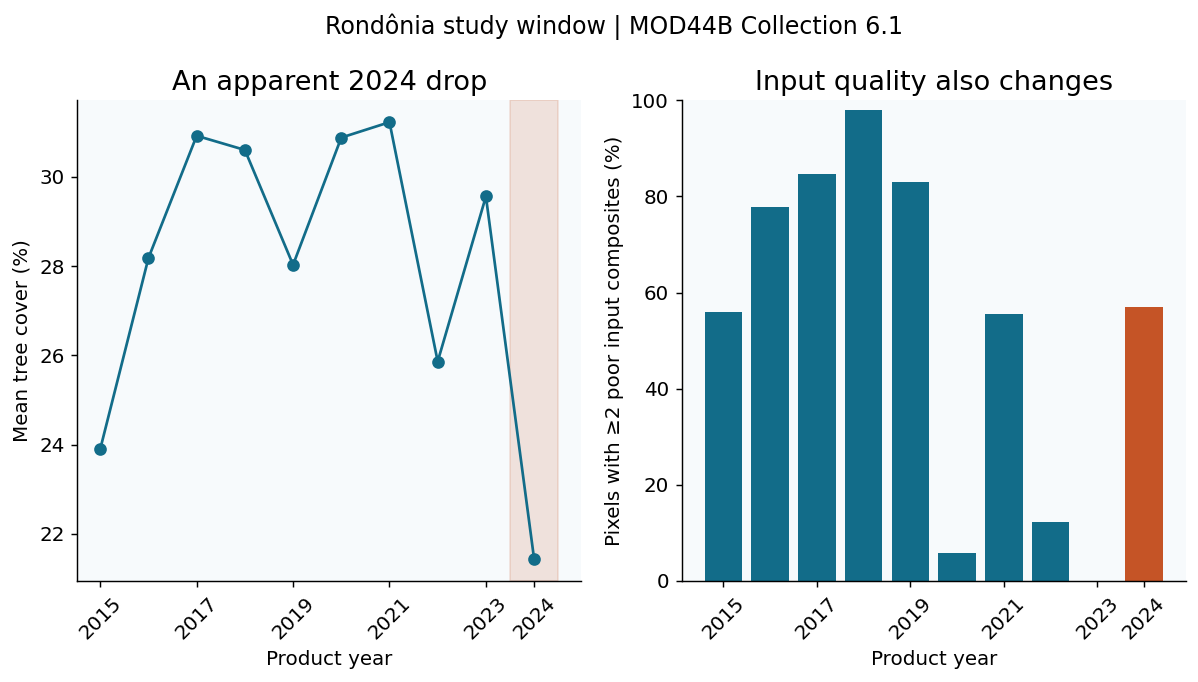
The quality layer changes alongside the tree-cover layer
The study uses a 41-by-41-cell MOD44B Collection 6.1 window centered at 10.65° S, 62.85° W. In 2023, one of its 1,681 cells has two or more poor input composites. In 2024, 957 cells do, or 56.93% of the window.
The MOD44B user guide advises caution at that threshold. The eight-bit Quality layer records flags for input composites; it is not a single per-year valid/invalid switch. Counting the set bits preserves what the field actually represents.
| Product year | Mean tree cover (%) | Cells with ≥2 poor inputs | Share of cells (%) |
|---|---|---|---|
| 2015 | 23.90 | 942 | 56.04 |
| 2016 | 28.18 | 1307 | 77.75 |
| 2017 | 30.92 | 1423 | 84.65 |
| 2018 | 30.60 | 1646 | 97.92 |
| 2019 | 28.03 | 1397 | 83.11 |
| 2020 | 30.88 | 98 | 5.83 |
| 2021 | 31.22 | 934 | 55.56 |
| 2022 | 25.86 | 207 | 12.31 |
| 2023 | 29.56 | 1 | 0.06 |
| 2024 | 21.43 | 957 | 56.93 |
What NASA’s runtime notice says
The LDOPE notice HC_MOD_26187, published 6 July 2026, reports that products for 2024 onward use Java 21 rather than Java 11. It warns that identical inputs can produce retrieval differences, including lower tree-cover estimates over mixed vegetation.
This is relevant evidence for comparing the 2023 and 2024 products. It does not quantify the runtime effect in this particular window, and it does not establish that every observed decrease is a software artifact. A source-documented comparability issue and a site-specific causal explanation are different levels of evidence.
A shared quality subset still shows a drop
We repeat the paired comparison using only the 724 cells with fewer than two poor-input flags in both years. Their mean change is −8.672652 percentage points. The drop therefore remains under this common quality screen.
That sensitivity check removes one difference in the admitted cells. It does not remove the runtime transition or recreate both years under identical processing. It is a diagnostic, not a correction that makes the two products perfectly comparable.
The result also argues against an easy one-factor story: simply discarding the higher-flag cells does not make the decline vanish. The remaining attribution question needs evidence that is not supplied by this subset analysis.
Reproduce the window, pairing and units
We request ten annual MOD44B products from 2015 through 2024, with five kilometres above, below, left and right of the center. The returned grid has 1,681 cells at 231.656358264-metre spacing. We preserve the actual response rather than substituting a nominal pixel size.
Tree-cover values from zero through 100 are retained, and the window mean is the arithmetic mean across the equal-area cells. For quality, we count the set bits in each eight-bit value and separately count cells at or above two. The paired analysis matches the same pixel indexes between 2023 and 2024.
The reported −8.125521 difference for the full window is in percentage points, calculated as 21.434265 minus 29.559786. It should not be relabeled an 8.13% relative decline or converted directly into an independently verified forest-loss area.
What would settle the land-change question?
No independently validated Landsat deforestation map or same-input reprocessing comparison was obtained for this study. Those missing checks leave the allocation among real change and processing effects unresolved.
The 2024 product interval begins on 5 March and represents an annual compositing period, not a single-date image or an exact January–December observation. The window is local, not a Rondônia-wide estimate. Mixed pixels also contain non-tree vegetation and nonvegetated cover, so a tree-cover change needs to be read with those components.
The defensible conclusion is a comparability warning: inspect product notices and quality before attaching a land-loss explanation to a sharp annual step. This dataset shows a real difference between retrieved values; identifying how much physical change it represents is the next question.
Sources and data
Source snapshots were retrieved on 6 October 2026. The observation dates and product versions are stated above; retrieval does not make a historical record current.
- NASA MOD44B tree-cover and quality subset (Collection 6.1; 2015–2024)
- NASA LDOPE MOD44B Java runtime issue (HC_MOD_26187; 2026-07-06; issue 1406)
- MODIS Vegetation Continuous Fields user guide (Collection 6; quality bit semantics and caution threshold)
- NASA MOD44B C6.1 catalog (DOI 10.5067/MODIS/MOD44B.061)
Dataset credits
- C. Dimiceli, M. Sohlberg, J.R.G. Townshend. 2022. MOD44B MODIS/Terra Vegetation Continuous Fields Yearly L3 Global 250m SIN Grid V061. NASA EOSDIS Land Processes DAAC. https://doi.org/10.5067/MODIS/MOD44B.061
- ORNL DAAC. 2018. Terrestrial Ecology Subsetting & Visualization Services (TESViS) RESTful Web Service. ORNL DAAC. https://doi.org/10.3334/ORNLDAAC/1600
Download B456-vcf-yearly.csv (CSV) · Download B456-vcf-paired.csv (CSV) · Download B456-vcf-pixels.csv (CSV)