Launch Watch · Evidence study
Published
Saharan dust in 2020: a map and a lidar slice answer different questions
Read real GEOS maps beside a CALIOP transect to separate modeled dust optical thickness, sampled plume height and unsupported regional claims.
The orange plume stretches across the Atlantic on one graphic. On the next, a dark band sits close to the bottom of an altitude axis. Both describe the June 2020 Saharan dust event, but they cannot be read as interchangeable views of one measured volume.
The first is a sequence of regional model maps. The second is a satellite lidar transect. Combining them is useful when each keeps its own job: the maps provide horizontal context, and the curtain shows vertical structure along a sampled path. Trouble begins when the regional map is treated as a height measurement, or one narrow slice is extended across the whole plume.
Here is a worked compatibility check using the actual NASA visual pair, with the dates, quantity and coverage made explicit.
Start with the axes, not the colors
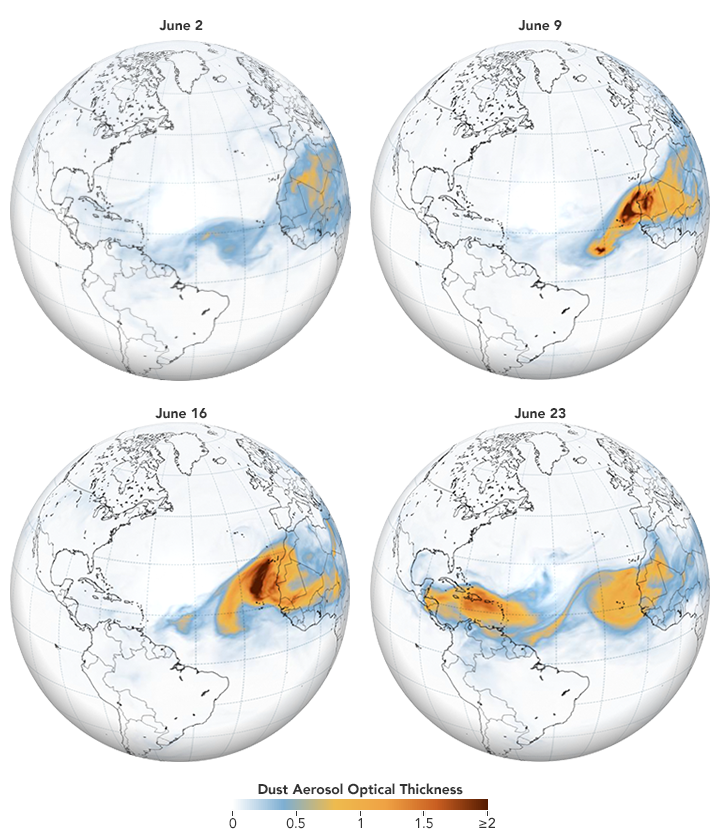
The NASA Earth Observatory account identifies the maps as output from the Goddard Earth Observing System, or GEOS, modeling system. The selected file contains four panels dated June 2, 9, 16 and 23, 2020. Its legend says “Dust Aerosol Optical Thickness” and runs from zero to a top category of at least two.
Optical thickness is dimensionless. It describes an optical effect through the atmospheric column; it does not give the height of the material within that column. The map’s orange and brown areas therefore cannot be read as kilometers above the surface. They also do not supply a mass or ground-level concentration simply because the plume looks dense.
In the final panel, the modeled plume extends into the Caribbean. That is a regional pattern visible in this field. It gives a reader a reason to look at the Caribbean transect without pretending that the model map and the instrument curtain are the same measurement.
Now turn the atmosphere sideways
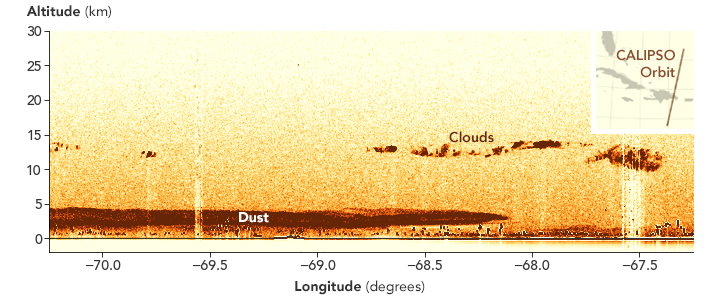
The curtain comes from the Cloud-Aerosol Lidar with Orthogonal Polarization, CALIOP, on the CALIPSO satellite. NASA identifies this pass over the Dominican Republic as June 23, 2020. Longitude runs along the bottom of the graphic and altitude, in kilometers, runs vertically. The orbit inset is essential: it shows where this slice was sampled.
The provider labels a low band as dust and separate higher structures as clouds. NASA reports the dust reaching approximately four kilometers, with dust also at or below one kilometer on this transect. Those are approximate provider-reported descriptions of this sample, not new height retrievals from its colors.
The colors in the curtain are not the map’s optical-thickness legend. Reading a brown curtain pixel as the same numerical quantity as a brown map pixel would silently cross from one representation into another. This comparison uses the curtain’s axes, labels and documented interpretation; it assigns no numerical meaning to its display intensity.
The two-row compatibility test
| Visual | Dates | Quantity | Axes or units | Coverage | Useful reading |
|---|---|---|---|---|---|
| GEOS regional maps | June 2, 9, 16 and 23, 2020 | Modeled dust aerosol optical thickness | Dimensionless; displayed scale 0 to ≥2 | Horizontal regional fields | Regional plume pattern; no altitude axis |
| CALIOP curtain on CALIPSO | June 23, 2020 | Instrument-derived vertical transect | Altitude (km) versus longitude (degrees) | Narrow orbital path over the Dominican Republic | Sampled vertical layering; no regional coverage |
The table exposes the missing dimension in each view. A regional column map has broad horizontal coverage but does not locate the column’s material vertically. An orbital curtain provides vertical detail but only along its sampled path. Neither view becomes a full observed three-dimensional field when placed next to the other.
That distinction is especially important when making a comparison look polished. A shared date is helpful context, but it is not a guarantee of matching observation time, spatial sampling or variable. The selected map is a dated model panel; the curtain is a pass along a track. Their June 23 labels alone cannot establish a collocated validation experiment.
Which statements survive the pairing?
Three possible claims make the test concrete. “The modeled plume extends into the Caribbean by the June 23 panel” is supported by the regional field. “The sampled curtain contains a low dust layer below higher cloud features” is supported by the labeled transect. “The dust everywhere in the Caribbean reaches the same height as this curtain” requires coverage that this pair does not provide.
The useful combined statement is narrower and stronger: regional modeled transport context and a real vertical sample show different aspects of the same event. It preserves the source of each part rather than blending their authority.
Why can’t the optical-thickness map answer “How high is the plume?”
Its horizontal positions and dimensionless optical-thickness legend do not include an altitude coordinate. The vertical arrangement must come from a product that resolves or estimates height, such as the sampled CALIOP curtain shown here. The curtain still applies only to its track.
What would be needed for a model-versus-observation test?
Matching physical variables, locations and times would have to be established, along with the relevant sampling and retrieval definitions. This visual pair supplies context for that work; it does not perform the matching or quantify a model error.
Keep the final sentence within the coverage
This analysis reads unchanged provider visualizations. It does not download and fit CALIOP profiles, retrieve aerosol mass, estimate ground concentration, evaluate local health risk, or create a regional height field. It also makes no claim that the displayed colors identify particle composition.
For a report or dashboard, the best caption should carry three things alongside the image: the source type, the quantity and the spatial support. Here that means a modeled regional column field beside an observed-data orbital slice. Once those remain visible, the two pictures can teach more together without claiming more than either actually contains.
Sources and image use
- NASA Earth Observatory: A Dust Plume to Remember, July 1, 2020. Source of the selected maps, curtain, dates, credits and approximate transect-height description.
- NASA and CNES: Space Laser Measures Massive Saharan Dust Plume, for mission and event context. Heights from other passes are not substituted for this June 23 transect.
- NASA images and media guidelines. Both visuals are reproduced unchanged with their respective creator and data-team credits, without endorsement implications.