Launch Watch · Launch Watch · Evidence study
Published
A satellite catalog grew by 14,102 objects, but the categories tell different stories
Four NASA box scores show catalog growth from 19,952 to 34,054 objects. Separating spacecraft from the rocket-body and debris category changes the interpretation.
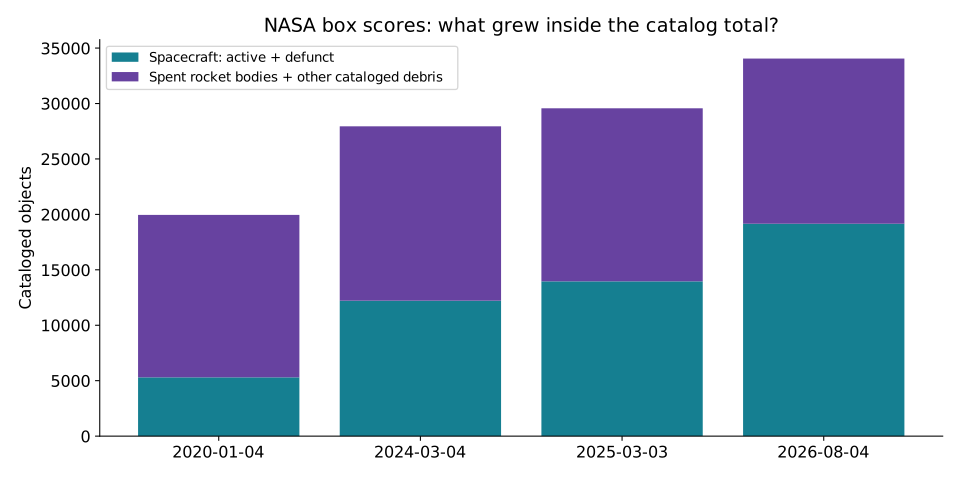
The worldwide total in four selected NASA satellite box scores rises from 19,952 objects in January 2020 to 34,054 in August 2026. That increase of 14,102 sounds straightforward. Open the total into its two categories, however, and most of the endpoint change sits in the spacecraft column.
The spacecraft count rises by 13,853. Spent rocket bodies and other cataloged debris rise by 249 between the same endpoints. A catalog total can grow substantially while its component categories move very differently.
Open full-size figure · Download PNG figure
Read the category labels before the numbers
The NASA Orbital Debris Quarterly News Satellite Box Score explicitly includes both active and defunct spacecraft in its spacecraft category. Relabeling that column “operational satellites” would change what the source measures.
The other category combines spent rocket bodies with other cataloged debris. It is also narrower than the entire orbital debris population: these box scores cannot count every small, untracked object. This article preserves the published worldwide categories rather than treating the table as a census of everything in orbit.
| As of | Spacecraft, active and defunct | Spent rocket bodies and other cataloged debris | Total |
|---|---|---|---|
| 2020-01-04 | 5,301 | 14,651 | 19,952 |
| 2024-03-04 | 12,215 | 15,727 | 27,942 |
| 2025-03-03 | 13,961 | 15,607 | 29,568 |
| 2026-08-04 | 19,154 | 14,900 | 34,054 |
Two intervals, two debris-category results
For the January 2020 to August 2026 endpoints, subtracting 14,651 from 14,900 gives a net increase of 249 in the spent-rocket-body and other-debris category. For March 2024 to August 2026, subtracting 15,727 from 14,900 gives a net decrease of 827. Both statements are supported because they specify different start dates.
Over the longer selected interval, the total grows by approximately 70.68%. The spacecraft share of that total also changes: from about 26.57% in January 2020 to 56.25% in August 2026. A percentage describing the mix of categories should not be mistaken for the fraction of spacecraft that are active; the source does not split active from defunct in this table.
A snapshot is a stock, not a flow
Each row tells us how many cataloged objects were present in those categories at one stated time. Subtracting rows gives a net stock change. It does not separately count launches, newly cataloged fragments, reentries, breakups or classification updates.
Imagine trying to recover arrivals and departures from two head counts alone. Many different combinations could produce the same difference. The same limitation applies here. An attribution such as “827 pieces reentered” would need event-level evidence that these snapshots do not provide.
The dates are also irregularly spaced. The four bars are discrete observations, not a continuous curve. They cannot establish that either category rose or fell smoothly in the gaps. The chart deliberately avoids interpolating values between issues.
How to reproduce the comparison
We extracted the worldwide Satellite Box Score totals from the final-page tables in four issues: the snapshots dated 4 January 2020, 4 March 2024, 3 March 2025 and 4 August 2026. The 2020 table is on PDF page 16; the other three are on PDF page 10. Those as-of dates, rather than the download date, label the rows.
For every row, spacecraft plus spent rocket bodies and other cataloged debris must equal the published total. We then subtract the first selected value from the last for each category and divide spacecraft by total to calculate the share. The CSV retains the counts, source PDF name and page number.
Country groupings differ between issues, so this analysis uses worldwide totals only. Anyone extending it should inspect the grouping definitions before comparing country-level values.
A useful sentence keeps both dates and definitions
The bounded finding is that these selected NASA box scores show 14,102 more cataloged objects between January 2020 and August 2026, with different net changes in the two published categories. It describes a changing catalog without claiming a complete debris census or a collision-risk forecast. For an individual object’s identity and orbit context, start with the satellite tracker and retain its own observation time.
Sources and data
Source snapshots were retrieved on 6 October 2026. The observation dates and product versions are stated above; retrieval does not make a historical record current.