Launch Watch · Spaceflight
Published
The widest eclipse path and longest totality belong to different eclipses
A 67-eclipse catalogue audit separates path width from central duration: the 2033 widest-path prediction is 781 km but 2m37s, while 2009 reaches 6m39s.
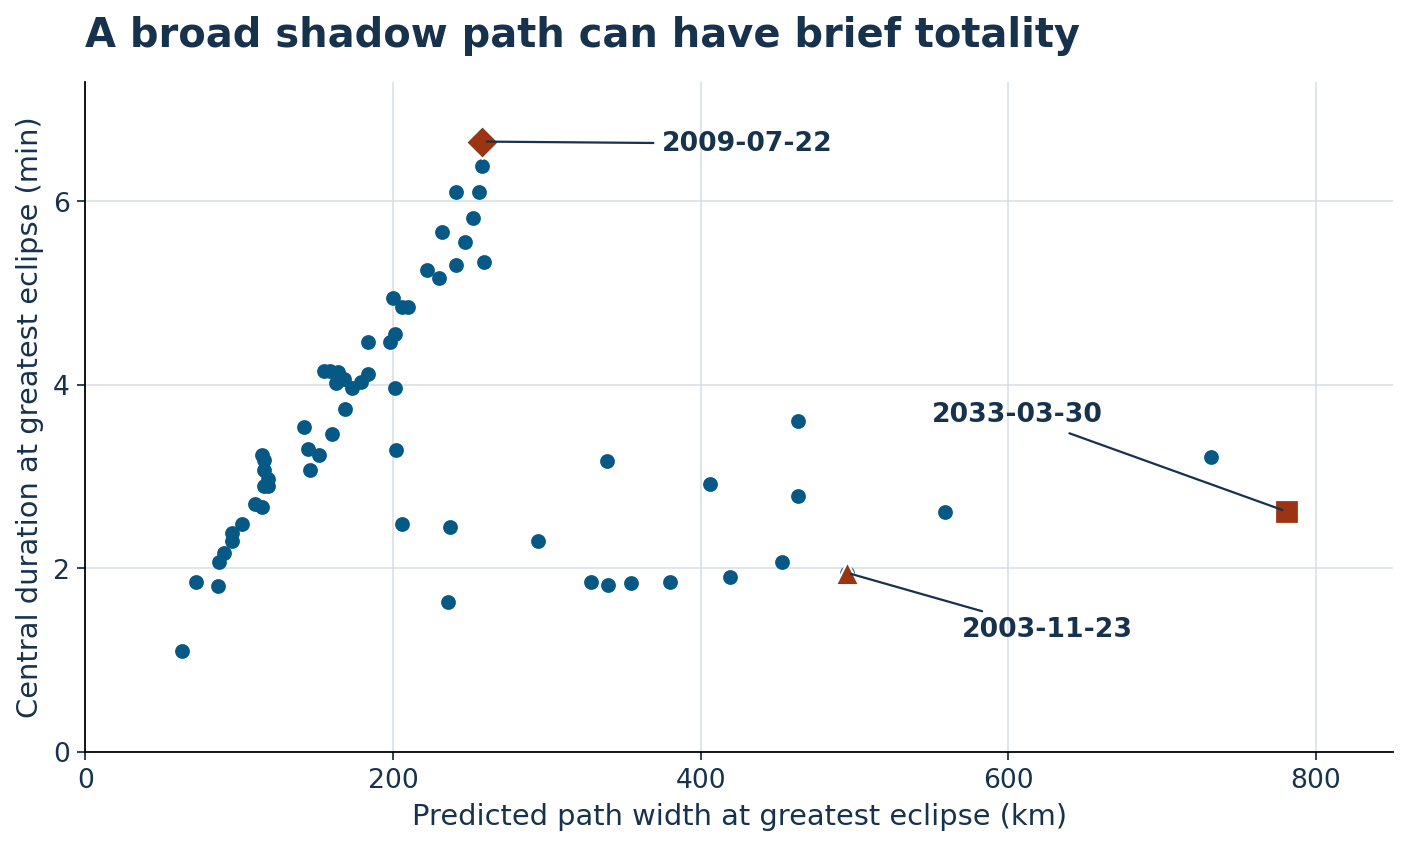
The widest total-eclipse path in a century-long catalogue is not the one with the longest central totality. Among 67 comparable rows, the catalogue predicts a 781-kilometer path on March 30, 2033, with 2 minutes 37 seconds of central totality. Its longest-duration row, July 22, 2009, has a 258-kilometer path and 6 minutes 39 seconds.
These values come from the NASA/Espenak–Meeus 2001–2100 eclipse catalogue. They are catalogue predictions, including the entries for past eclipses. They are not measurements of shadow width or the latest location-specific forecasts.
The historical rows make the same point
| Catalogue eclipse date | Role in comparison | Path width (km) | Central duration |
|---|---|---|---|
| 2003-11-23 | Historical wide-path counterexample | 495 | 1 min 57 s |
| 2009-07-22 | Longest duration in selected catalogue rows | 258 | 6 min 39 s |
| 2033-03-30 | Widest path; future-event prediction | 781 | 2 min 37 s |
The November 2003 entry already supplies a counterexample without relying on a future event. Its 495-kilometer path is about 1.92 times as wide as the 2009 entry’s 258-kilometer path, yet its central duration is only 117 seconds compared with 399 seconds.
The future 2033 comparison is more extreme: its catalogue path is about 3.03 times wider than 2009’s, while its listed duration is only about 39.35% as long. Width alone therefore cannot rank these eclipse durations.
Keep “at greatest eclipse” in both labels
The catalogue key defines the width and central-duration fields at greatest eclipse. That common reference event makes the two fields comparable across rows, but it does not make them the same physical quantity.
Path width describes the transverse reach of the central shadow path at that reference event. Duration describes how long central totality lasts there. A wider footprint does not, by itself, specify how long a location remains inside it. The catalogue comparison establishes that the rankings differ; we do not fit a causal law to the scatterplot.
Neither number gives the duration in a particular city, nor the width everywhere along the path. Selecting an eclipse for travel or planning an observation requires a current, location-specific prediction. The chart is a metric comparison, not a route or viewing recommendation.
Why 224 rows become 67
The retained century catalogue has 224 eclipse rows. We keep only the exact central-total type “T” and require both path width and central duration. That produces 67 rows.
The catalogue also contains a noncentral total entry marked “T+” on April 9, 2043. Its comparable width and central-duration fields are absent. We exclude that row rather than turning a missing value into a zero. Annular, hybrid and partial eclipse rows also fall outside this particular question.
The historical subset through 2025 contains 15 selected rows. Its widest-path row is the November 2003 entry; its longest-duration row is July 2009. Stating the selection prevents “widest” from drifting into an unsupported claim about every eclipse in history.
Reproduce the rankings
The 67-row CSV contains date, catalogue number, type, greatest-eclipse time as supplied, solar altitude, width and central duration in seconds. Sort once by width and once by duration. The top rows differ.
For the ratio check, divide 781 by 258. For the duration fraction, divide 157 by 399 and multiply by 100. A separate historical check filters dates through 2025 before repeating both sorts.
The original time field is TD, not UTC. The catalogue uses modeled time-scale differences for future dates; its original assumptions remain part of this retained prediction set. We downloaded the source on October 5, 2026 and preserve its values rather than substituting a modern local forecast midway through the comparison.
Sources and prediction credit
- Catalogue of solar eclipses: 2001–2100, for the numerical rows.
- Catalogue key, for eclipse types, time scale and field definitions.
- Five Millennium Canon of Solar Eclipses, including the publication’s explicit reuse permission and source acknowledgment requirement.
Eclipse predictions by Fred Espenak and Jean Meeus, NASA/GSFC. Original chart and catalogue analysis: LaunchDetect. No source eclipse map or photograph is reproduced, and no NASA endorsement is implied.