Launch Watch · Launch Watch · Evidence study
Published
Why a 2020 MODIS phenology file contains 2019 and 2021 dates
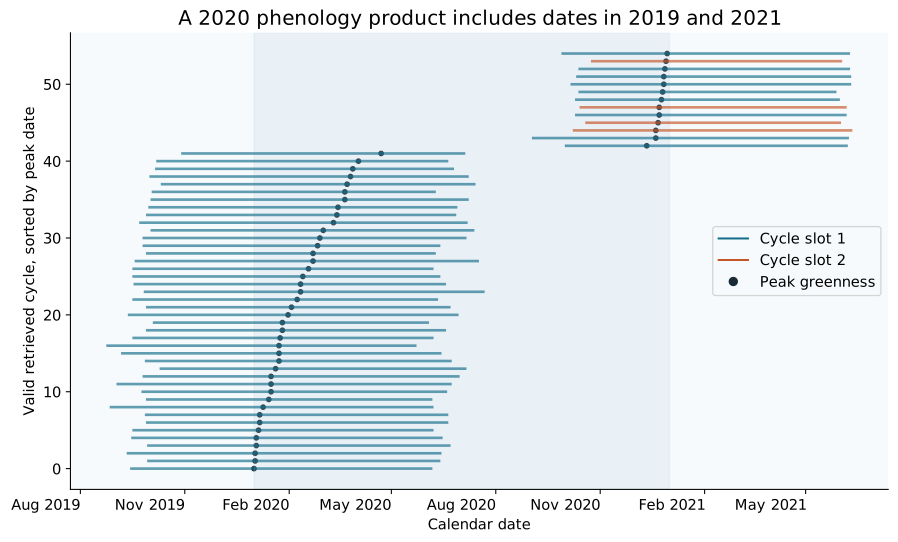
A 2020 MCD12Q2 sample near Sorriso has 55 vegetation cycles: all peak in 2020, while 42 greenups fall in 2019 and 13 dormancy dates in 2021.
A file labeled “2020” contains a vegetation greenup date in August 2019 and a dormancy date in June 2021. Those dates look suspicious if the filename is treated as a calendar-year filter. In MCD12Q2, however, a reported cycle is assigned by the year of its peak.
Our 13-by-13-cell sample near Sorriso, Brazil, makes the rule concrete. It contains 55 reported cycles. All 55 peaks fall in 2020, while 42 greenup dates fall in 2019 and 13 dormancy dates fall in 2021. The timeline shows complete cycles crossing the year boundaries.
Open full-size figure · Download PNG figure
Follow the peak, then keep the rest of the cycle
The MCD12Q2 Collection 6.1 guide describes a three-year time series used to estimate vegetation cycles. Up to two cycles are reported when their peak falls within the product year. Greenup and dormancy can lie outside that year because they describe the same cycle’s surrounding phases.
The earliest greenup in this sample is 25 August 2019; the latest dormancy is 10 June 2021. These are endpoints from the set, not necessarily the endpoints of one unusually long cycle. Cropping every phase to 2020 would truncate legitimate parts of the reported timelines.
| Field | Raw value | Decoded date or meaning |
|---|---|---|
| Pixel / row / column | 2 / 0 / 2 | Cycle slot 1 |
| Greenup | 18177 | 2019-10-08 |
| Peak | 18354 | 2020-04-02 |
| Dormancy | 18432 | 2020-06-19 |
| Overall QA | 0 | Best overall quality |
| Detailed QA | 0 | All phase-quality bits zero |
Decode the dates before interpreting them
The example’s greenup integer, 18177, means 18,177 whole days since 1 January 1970. It decodes to 8 October 2019. Reading it as a day-of-year would be an import error. The same conversion yields 2 April 2020 for the peak and 19 June 2020 for dormancy.
Before conversion, remove the fill value 32767. A fill value is a missing-data marker, not a very distant biological date. Keeping the raw integer beside the decoded date, as the downloadable CSV does, makes this check easy to audit and avoids losing the original encoding.
Count missing pixels separately
The study window has 169 pixels. Only 51 have valid NumCycles values; 118 are fill. Among the valid pixels, 47 report one cycle and four report two, giving 47 plus eight, or 55 cycles in total.
The fill pixels must not be counted as land with no vegetation. Similarly, two reported greenness cycles do not by themselves prove two harvested crops. These are algorithmic vegetation dynamics, not a crop-species or yield inventory. The small window is illustrative and is not a representative sample of all Sorriso or Brazilian agriculture.
Overall quality and phase quality answer different questions
All 55 reported cycles have overall QA equal to zero, the best overall category. Only 29 have every detailed phase-quality bit equal to zero. Those two counts can coexist because the summary quality field does not replace the phase-level fields.
For a question about one particular phase, retain and inspect its detailed quality bits. Calling every greenup an exact biological emergence date, or every dormancy a harvest date, would go beyond what this sample and its quality information support.
A repeatable import checklist
- Request MCD12Q2 A2020001 at latitude −12.55, longitude −55.72, with a three-kilometre half-width and half-height.
- Confirm the returned 13-by-13 grid, tile h12v10 and processing code 2022117221059.
- Exclude fill values before converting phase integers from days since 1 January 1970.
- Retain both reported cycle slots and both overall and detailed quality fields.
- Check the peak year for every valid cycle, then count greenup and dormancy years separately.
The chart includes all 55 reported cycles rather than selecting one especially neat pixel. The CSV includes pixel position, cycle slot, date encodings and quality values. Together they make the apparent year mismatch understandable: the product year indexes peak greenness, while the rest of the cycle retains its actual calendar dates.
Sources and data
Source snapshots were retrieved on 6 October 2026. The observation dates and product versions are stated above; retrieval does not make a historical record current.
- NASA MCD12Q2 phenology subset via ORNL DAAC (Collection 6.1, product year 2020, proc 2022117221059)
- MODIS Land Cover Dynamics C6.1 Product User Guide (Collection 6.1; peak-year assignment and days-since-1970 definitions)