Launch Watch · Launch Watch · Evidence study
Published
TESS Sector 8: a downlink schedule overstates published data spans by 79 hours
For TESS Sector 8, contact-derived windows total 563.25 hours while published FFI spans total about 484.00. A first-year audit shows why the lists differ.
TESS Sector 8 has 563.25 hours of contact-derived observing windows in one mission table. Its published full-frame-image collection spans add to about 484.00 hours in another. The difference is 79.25 hours, enough to matter when deciding whether an event could fall within a data span.
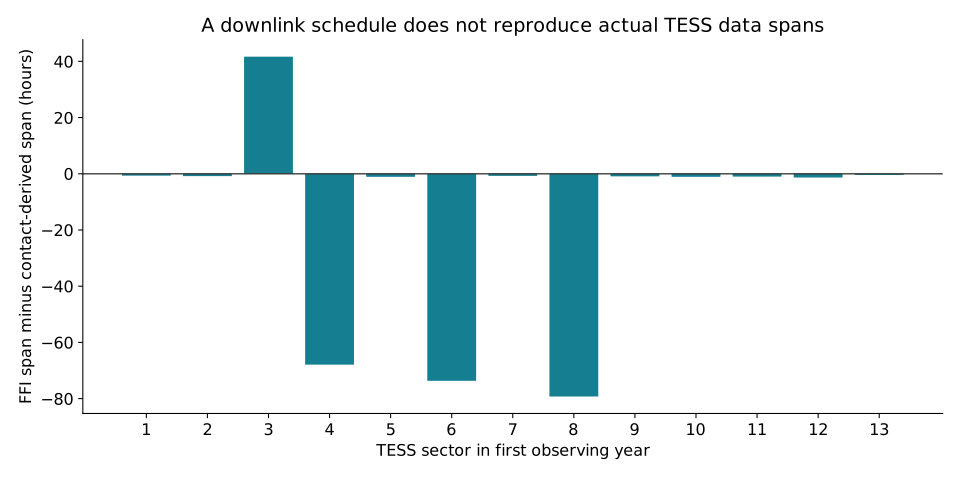
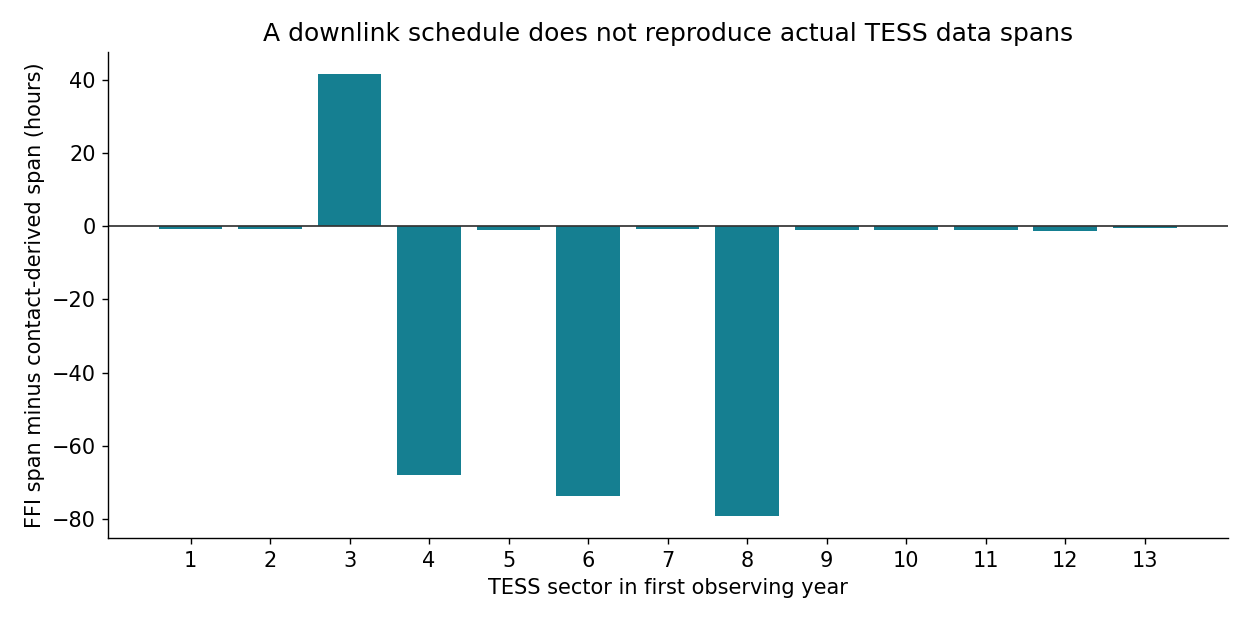
Yet the mismatch does not always point in that direction. Sector 3’s FFI spans total about 652.00 hours, exceeding its 610.33 contact-derived hours. Comparing all first-year sectors shows why the difference should not be labeled a simple data-loss metric.
Open full-size figure · Download PNG figure
Two tables answer different questions
MIT’s TESS observations page distinguishes the schedule-derived windows associated with contacts from the list of actual full-frame-image, or FFI, observation times. The contact-derived list does not include every unscheduled interruption and should not be treated as a complete collection log.
For sectors 1–13, the contact-derived list contains 26 intervals. The FFI list contains 35. A sector can therefore be partitioned differently in the two sources, even before their total spans are compared.
| Sector | Contact-derived spans (h) | FFI spans (h) | FFI minus contact (h) |
|---|---|---|---|
| 1 | 641.67 | 641.00 | -0.67 |
| 2 | 623.33 | 622.50 | -0.83 |
| 3 | 610.33 | 652.00 | +41.67 |
| 4 | 597.92 | 530.00 | -67.92 |
| 5 | 599.08 | 598.00 | -1.08 |
| 6 | 570.17 | 496.50 | -73.67 |
| 7 | 547.25 | 546.50 | -0.75 |
| 8 | 563.25 | 484.00 | -79.25 |
| 9 | 577.92 | 577.00 | -0.92 |
| 10 | 606.58 | 605.50 | -1.08 |
| 11 | 625.00 | 624.00 | -1.00 |
| 12 | 645.83 | 644.50 | -1.33 |
| 13 | 660.42 | 660.00 | -0.42 |
Read the large differences before the small ones
Sector 8 has two contact-derived intervals and three FFI intervals. Its FFI-minus-contact difference is approximately −79.25 hours. Sector 6’s is −73.67 hours and Sector 4’s is −67.92 hours. Sector 3 goes the other way, at +41.67 hours, with eight FFI intervals rather than two contact-derived intervals.
The signs are retained deliberately. Dropping the positive value or converting every mismatch to a loss would hide evidence that the lists have different purposes and histories. This calculation does not identify the cause of any particular interruption.
Small differences need additional caution. Native FFI cadence in this first-year record is 30 minutes, and interval endpoint conventions matter at subhour scales. The multi-day differences are the most useful examples here; small mismatches should not be treated as precise measures of lost exposures.
A span is not an exposure budget
For each published interval, we subtract start time from end time. We then add those durations within the sector. That produces a sum of listed time spans, not detector integration time or a target-specific good-exposure total.
A source can lie inside a listed interval without yielding usable data for a particular scientific question. Image availability, target coverage and quality filtering need their own checks. The TESS data-product documentation is the appropriate next layer when selecting actual files.
Reproduce the 13-sector comparison
We use the two current MIT CSV files, restrict both to historical sectors 1–13, and preserve the exact timestamp strings. Future planned rows are outside the selection. Each list is checked for overlapping intervals before summing end-minus-start within a sector.
The published timestamp strings carry no timezone suffix. The accompanying CSV preserves their source convention rather than silently adding a UTC label. The article rounds duration sums to two decimal places, while the calculation files retain their numerical values and the original intervals.
The sector summary includes interval counts as well as the two duration sums. Downloading the interval files makes it possible to inspect the pieces behind a total rather than relying only on the difference bar.
Use the table that fits the decision
A contact schedule is useful for understanding planned operations. For an event-data search, start with the actual observation intervals, then confirm the relevant files and their quality. This audit demonstrates the cost of substituting the first list for the second without claiming either list measures usable exposure on its own.
The reusable check is to ask what created a timestamp: a plan, a contact, an acquisition or a processed data product. That distinction also underlies the satellite-image evidence lifecycle.
Data and mission credit: NASA TESS mission, MIT TESS operations and NASA Science Mission Directorate funding. This analysis uses the mission-operation timing tables hosted by MIT, with original interval calculations and figures.
Sources and data
Source snapshots were retrieved on 6 October 2026. The observation dates and product versions are stated above; retrieval does not make a historical record current.
- tess orbits.csv
- tess ffi.csv
- tess observations.html
- tess data.html
- NASA TESS frequently asked questions
- NASA TESS mission factsheet
Download B444_tess_ffi_intervals.csv (CSV) · Download B444_tess_sector_spans.csv (CSV) · Download B444_tess_contact_intervals.csv (CSV)