Launch Watch · Satellite
Published
TROPOMI’s 2019 pixel-size change, checked in two NO₂ orbit files
Calculate 210 actual pixel polygons around TROPOMI’s August 2019 transition. Sampled mean area falls 22.217%, rather than the ratio of rounded size labels.
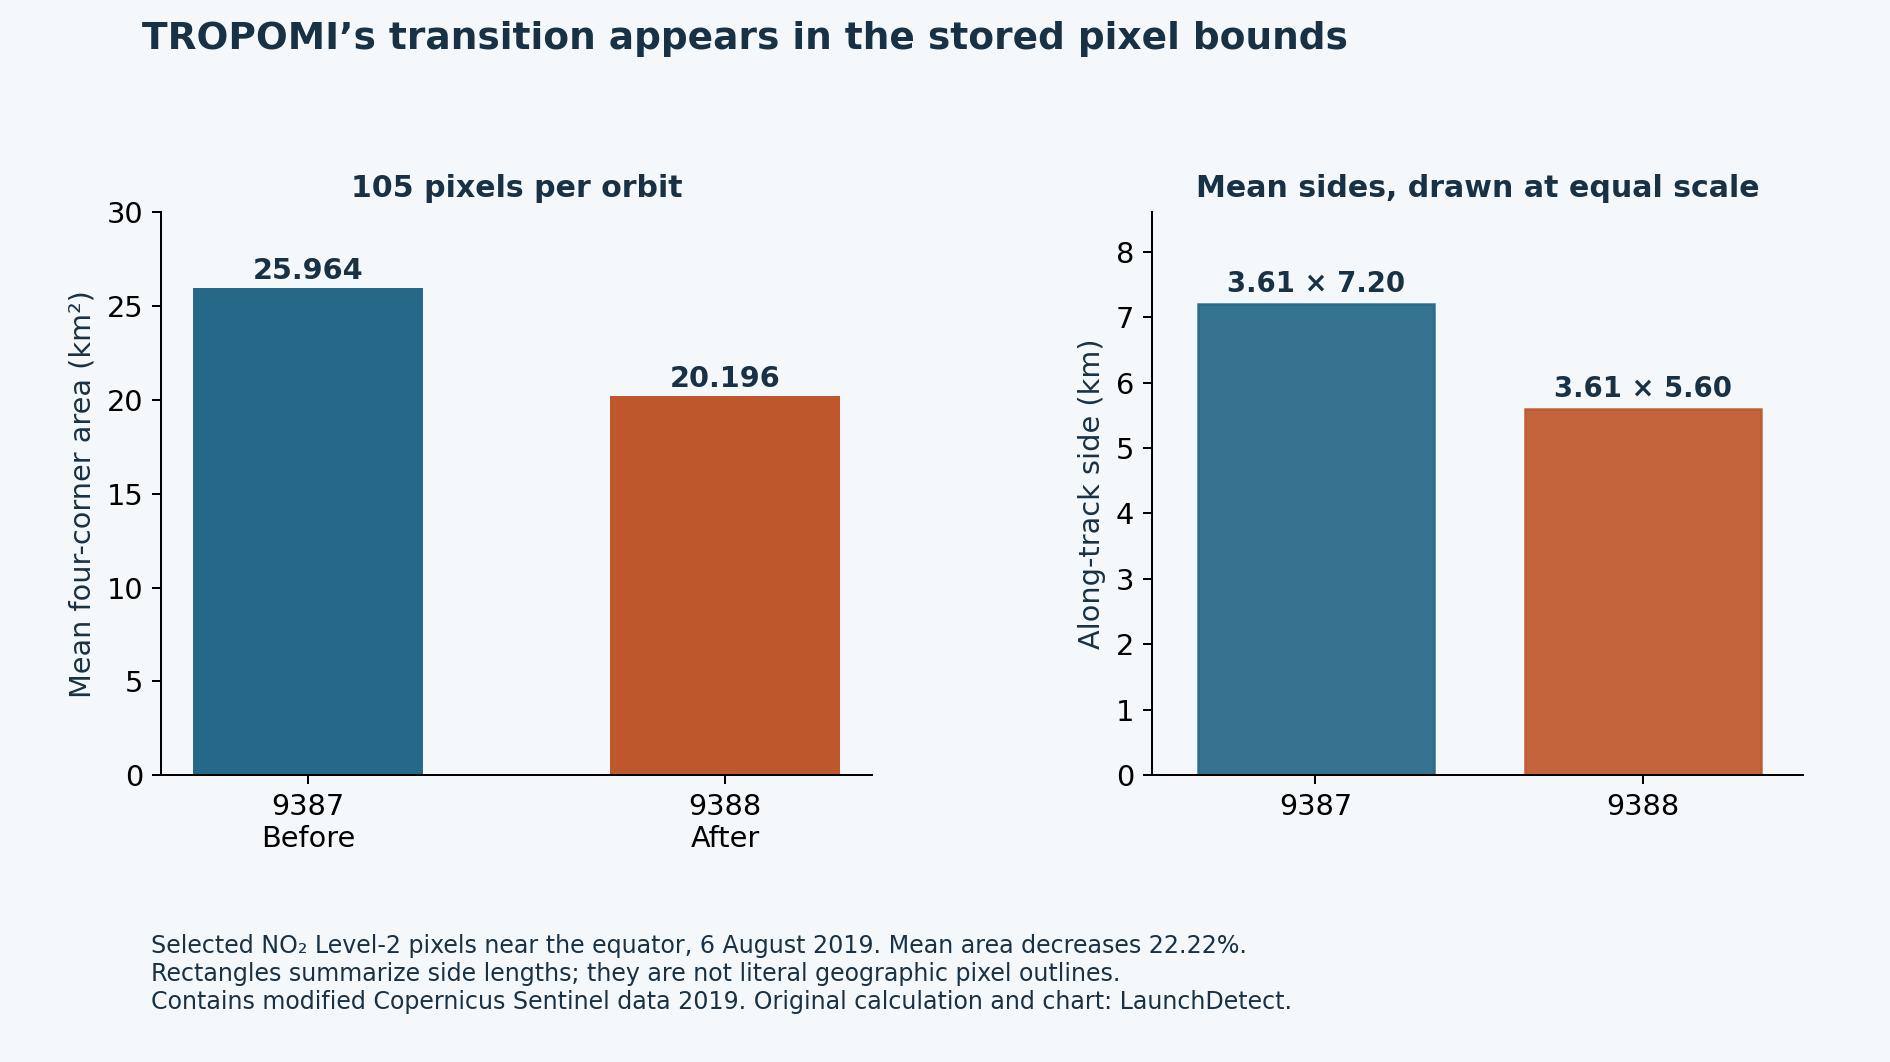
Across TROPOMI’s 6 August 2019 sampling change, two small samples of actual NO₂-product pixel bounds have mean areas of 25.964 km² before and 20.196 km² after. That is a 22.217% reduction in the sampled mean area. It is close to the 22.222% reduction in the instrument’s co-addition time, and differs from the 21.429% implied by dividing the rounded labels 5.5 km and 7 km.
We calculated 210 four-corner geographic polygons, 105 from orbit 9387 and 105 from orbit 9388. This is a geometric comparison of two different near-equatorial ocean neighborhoods. It is not a before-and-after pollution measurement at one location, and it does not establish one footprint size for every TROPOMI band or product.
What changed at orbit 9388
The instrument-team calibration paper dates a radiance co-addition-time change from 1,080 to 840 milliseconds to orbit 9388 on 6 August 2019. It describes the associated minimum along-track sampling distance as roughly 7 km before and 5.5 km afterward. It also gives different across-track sampling scales for different spectral bands.
That makes two consecutive historical NO₂ Level-2 files a useful place to check the geometry itself. The source files’ temporal-resolution fields read PT1.080S and PT0.840S respectively. Both retained files still carry a summary string containing “7x3.5km.” For this test, the actual geographic bounds are more informative than that short summary label.
Use the bounds, with an explicit sample
For each file, we found the scanline whose center at ground-pixel column 225 is closest to the equator. We retained that scanline, ten on either side, and columns 223 through 227. All indices are zero-based. The selection is therefore 21 × 5 = 105 pixels per orbit.
| Orbit | Inclusive scanlines | Inclusive columns | Middle selected pixel, lon / lat | Pixels |
|---|---|---|---|---|
| 9387, before | 1288–1308 | 223–227 | −178.3555° / −0.0197° | 105 |
| 9388, after | 1659–1679 | 223–227 | 156.2657° / −0.0016° | 105 |
The longitudes make the geographical difference explicit. These are not repeat observations of the same ground patch. Selecting similar near-equatorial, middle-swath positions makes the scale comparison easier to interpret, but it does not hold every orbital and viewing condition constant.
Each selected record supplies four latitude_bounds and longitude_bounds corners. We calculated its WGS84 geodesic polygon area and four geodesic edge lengths, then summarized the 105 polygons. No NO₂ concentration, retrieval-quality threshold or atmosphere-change estimate enters that calculation. Valid geographic bounds are not evidence that the corresponding gas retrieval is suitable for a separate scientific analysis.
| Quantity | Orbit 9387 | Orbit 9388 |
|---|---|---|
| Mean area (km²) | 25.964009 | 20.195519 |
| Minimum sampled area (km²) | 25.950863 | 20.182441 |
| Maximum sampled area (km²) | 25.977372 | 20.210029 |
| Mean short-side pair (km) | 3.6078 | 3.6080 |
| Mean long-side pair (km) | 7.1967 | 5.5975 |
The side-pair entries average the two opposing edge means; they are a readable summary, not a replacement for the polygon-area calculation. The short sides barely change in these samples, while the long sides shorten substantially. Extra decimal places preserve the numerical result and do not imply millimetre-level geolocation accuracy.
Why the two percentage calculations differ
The measured comparison uses the polygons: 100 × (1 − 20.195519 / 25.964009), approximately 22.217%. The co-addition-time comparison is 100 × (1 − 840 / 1080), approximately 22.222%. Their close agreement is consistent with the documented sampling change, within the limits of this two-orbit test.
The nominal-dimension shortcut instead gives 100 × (1 − 5.5 / 7), approximately 21.429%. Neither 7 nor 5.5 is an exact measurement of our selected long sides. Rounded labels can describe the change correctly while giving a different ratio when treated as precise geometry.
The Sentinel-5P Level-2 data definition also distinguishes reported pixel-size metadata from actual sizes that depend on orbital altitude. An advertised resolution is a useful product description; it is not a substitute for per-pixel boundaries when the analysis needs area.
What this changes in an area-based workflow
When an analysis weights observations by their covered area, inspect the geographic bounds in the actual files and preserve the acquisition and processing identifiers. Do not assume a constant rectangle on both sides of this transition. Also check the relevant product definition: TROPOMI’s spectral bands do not all share one nominal across-track dimension.
For a pollutant trend or regional average, geometry is only one input. Quality filtering, coverage, regridding, retrieval versions and the averaging method would need their own treatment. A 22.217% smaller sampled footprint does not mean a 22.217% change in NO₂, and these two samples cannot demonstrate a pollution trend.
Reproduce the 210 polygon calculations
The 210-row geographic-bounds extract (CSV) retains every pixel’s orbit, scanline, column, center and four corners. The two-orbit provenance file (CSV) gives the original source URLs, exact selection indices and relevant metadata. Compare your calculated areas and edge lengths with the 210-row results (CSV).
For each input row, use a WGS84 geodesic polygon-area calculation on the four listed corners and take the absolute area in square metres divided by one million. Average the 105 areas within each orbit, then calculate 100 × (1 − mean-after / mean-before). This is a calculation from the product’s geolocation representation, not a laboratory measurement of the sensor’s spatial response.
Source files and attribution
- Orbit 9387 OFFL NO₂ source file and orbit 9388 OFFL NO₂ source file: original geolocation variables and metadata.
- Ludewig and colleagues, 2020, TROPOMI in-flight calibration: the change at orbit 9388 and band-specific sampling context.
- Sentinel-5P Level-2 input/output data definition: metadata and actual pixel-size caveats.
- Public archive entry and Sentinel legal notice: provenance and data-use terms.
Sources and bounds checked 4 October 2026. The chart and calculations are original LaunchDetect work using modified Copernicus Sentinel data 2019. No source-paper figure or satellite image is copied.