Launch Watch · Launch Watch · Current evidence
Published
Webb’s NGC 7129: compare the filters before the colors
The Webb and Spitzer views of NGC 7129 use different color maps. Our filter comparison shows why a red pixel does not identify one infrared measurement.
The new Webb image of NGC 7129 assigns the same red display color to two filters with very different widths. F444W’s effective bandwidth is about 20 times F470N’s. That difference matters when a reader tries to connect a striking color to the gas that produced it.
NASA released the NIRCam image on October 6, 2026, using observations from December 17, 2025. We compared its published filter-to-color assignments with the documented 2004 Spitzer image of the same nebula. Putting the wavelength choices on one axis is more informative than comparing red, green and blue by eye.
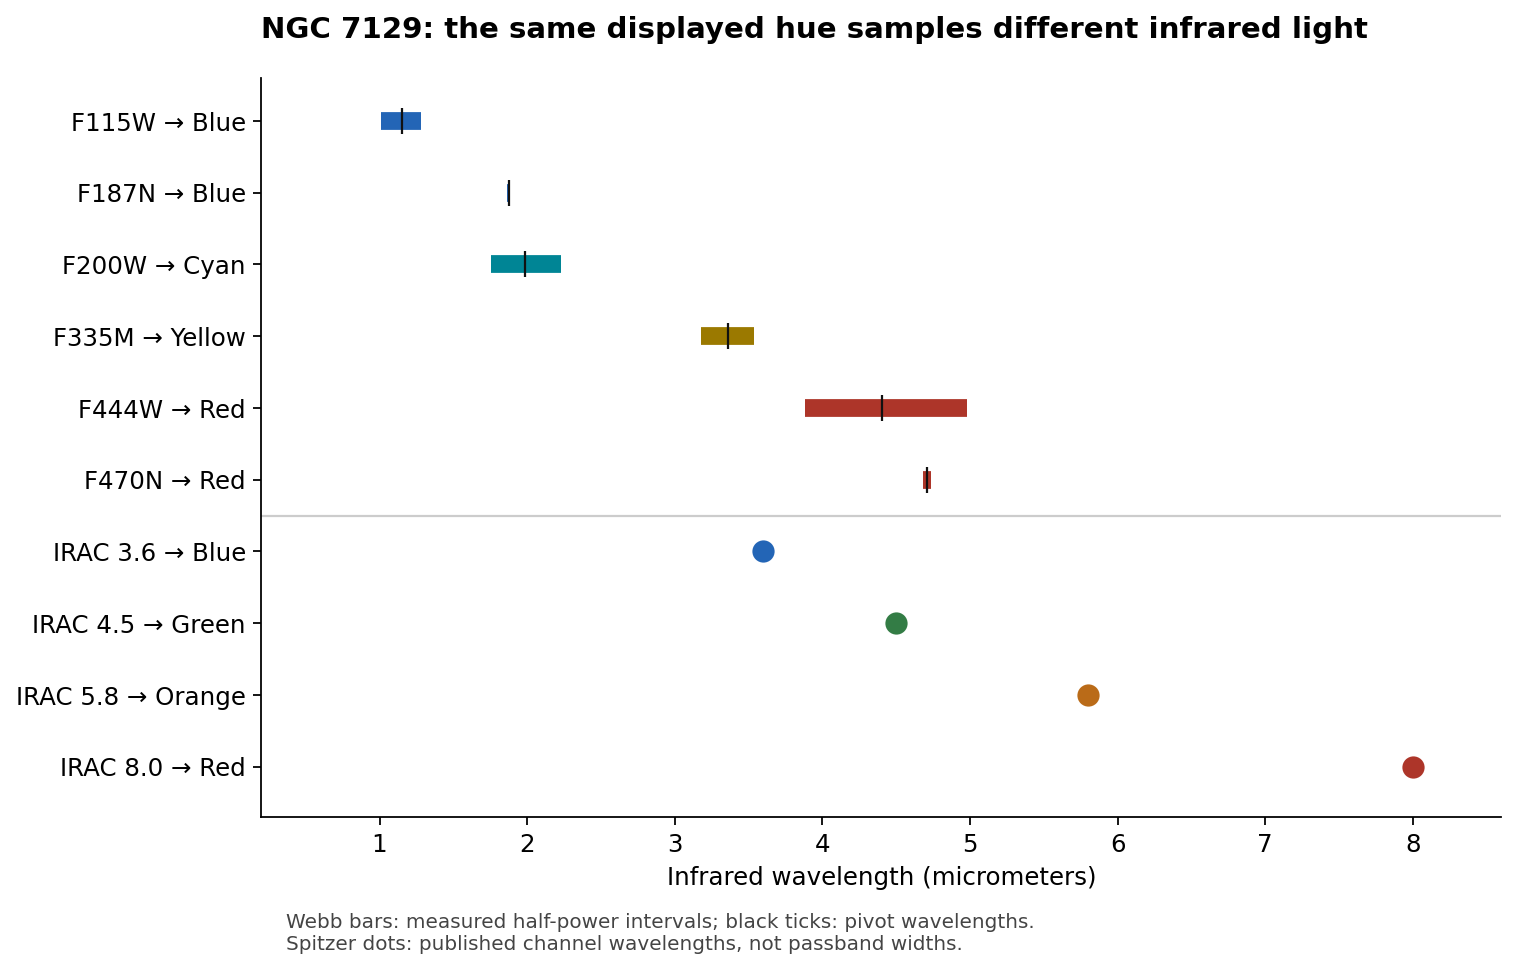
Two kinds of red in the Webb release
The Webb asset page lists six filters. Two feed the blue display channel, one feeds cyan, one feeds yellow and two feed red. The instrument team’s filter table supplies their pivot wavelengths, effective bandwidths and half-power limits.
| Webb filter | Pivot wavelength (µm) | Effective bandwidth (µm) | Display hue |
|---|---|---|---|
| F115W | 1.154 | 0.225 | Blue |
| F187N | 1.874 | 0.024 | Blue |
| F200W | 1.988 | 0.461 | Cyan |
| F335M | 3.362 | 0.348 | Yellow |
| F444W | 4.402 | 1.024 | Red |
| F470N | 4.708 | 0.051 | Red |
Dividing the listed effective bandwidths gives 1.024 / 0.051 = 20.08 for F444W versus F470N. The broad filter’s half-power interval runs from 3.881 to 4.982 micrometers; the narrow filter’s interval runs from 4.683 to 4.733 micrometers, inside that wider span.
That arrangement helps explain why the label “red” needs its processing context. F470N is designed for molecular-hydrogen observations, while F444W is a broad general-purpose filter. Their shared display hue does not make them equivalent measurements or make every red pixel a pure measurement of one emission line.
Spitzer’s green is close to Webb’s red wavelengths
The 2004 Spitzer release maps its 3.6, 4.5, 5.8 and 8.0-micrometer channels to blue, green, orange and red. Its green channel therefore samples infrared light near the wavelengths represented by red in the Webb release. Spitzer’s red channel, at 8.0 micrometers, samples much longer wavelengths than either of the Webb filters colored red here.
These are explicit choices for displaying invisible infrared observations. A patch can acquire a different hue when the contributing bands and their assigned colors change. Establishing physical evolution would require a comparison of calibrated measurements with suitable wavelength coverage, registration and resolution matching. The two color recipes alone cannot do that.
The telescope images also have different fields of view and spatial detail. This comparison uses the separately documented 2004 Spitzer release. It does not assume that every subsequently republished Spitzer crop has identical processing.
The science still comes from the measurements
NASA’s accompanying interpretation associates the golden cavity with hot atomic hydrogen and the red structures with cooler molecular hydrogen affected by protostellar outflows. That explanation rests on the observational context and astronomical analysis. A display-color name by itself does not supply a gas temperature or separate all of the light-producing components.
The blue and cyan assignments make the same point. F187N, assigned blue, has an effective bandwidth of 0.024 micrometers. F200W, assigned cyan, has a bandwidth of 0.461 micrometers, about 19.21 times wider. Their half-power intervals overlap even though their assigned hues differ.
Reproduce the comparison
Start with the six filters named in the NASA asset record. Copy the corresponding detector-averaged values from the STScI NIRCam filter table, version 7.0. Use its effective bandwidth column for the two width ratios. For the plotted bars, use the separate blue and red half-power limits; those endpoints mark where throughput falls to half its peak.
Effective bandwidth is an integral-based measure of a transmission curve, so it is not interchangeable with the distance between the half-power endpoints. The black tick on each Webb bar marks the pivot wavelength. Spitzer is shown as channel-wavelength dots because this comparison does not include its full passband curves.
The two downloadable CSVs preserve the numbers and color assignments used here. They are enough to rebuild the figure and the width ratios. No nebular flux, brightness change, chemical abundance or gas temperature was calculated. For another instrument-specific comparison, see our GOES-16 and GOES-18 spectral-response study.
Sources and data
Sources were checked on October 6, 2026. Observation dates, release dates and the source versions used in this comparison are identified above.
- NASA: NGC 7129 asset and color mapping, October 6, 2026
- NASA: NGC 7129 stellar-jets release, October 6, 2026
- STScI: NIRCam filter characteristics, version 7.0
- Spitzer: NGC 7129 image and channel colors, February 12, 2004
Download B459-webb-filter-comparison.csv (CSV) · Download B459-spitzer-color-map.csv (CSV)