Launch Watch · Launch Watch · Current evidence
Published
Rupert Bay’s Landsat water index: the offset does not cancel
In a September 27 Landsat 9 scene, the median green–NIR index changes from 0.052 to 0.346 after scaling. Here is the pixel-level test and its quality limits.
Using the stored numbers directly changes the result substantially in this Rupert Bay example. Across 636,771 retained water-flagged Landsat pixels, the median green–near-infrared normalized difference is 0.052. After the required scale and additive offset are applied, it is 0.346.
NASA’s October 6 Earth Observatory image provides the timely case: Landsat 9 observed the region on September 27, 2026. We used the corresponding Collection 2 surface-reflectance scene to test a processing shortcut. This is an arithmetic check, with the aerosol-quality limitations retained; it does not measure the brown water’s chemical composition.
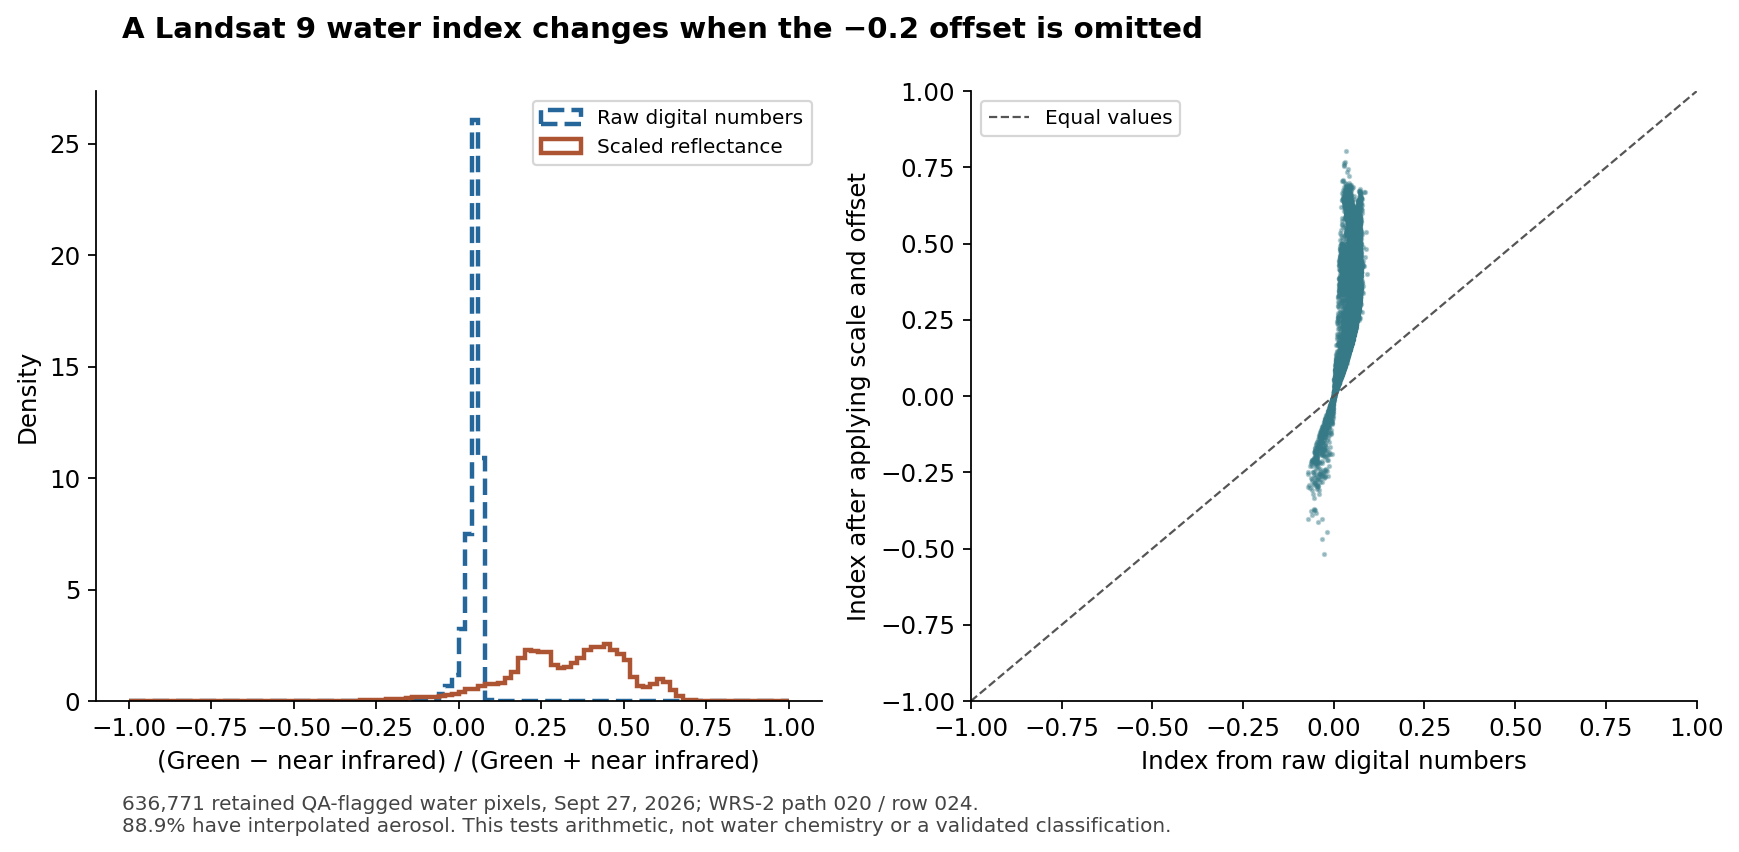
Why a normalized difference still needs the offset
USGS specifies the Collection 2 surface-reflectance conversion as the stored digital number multiplied by 0.0000275, followed by an offset of −0.2. The same conversion applies to the green and near-infrared bands used here.
For a normalized difference, subtract green and near-infrared reflectance, then divide by their sum. The two additive offsets cancel in the subtraction. They do not cancel in the sum: together they contribute −0.4 to the denominator.
With G and N representing the stored digital numbers, the correctly converted ratio can be written as 0.0000275 × (G − N), divided by [0.0000275 × (G + N) − 0.4]. Omitting the offset instead gives (G − N) / (G + N). Those expressions are different even though the multiplicative factor alone would cancel.
| Subset | Pixels | Median: raw numbers | Median: scaled reflectance | Pixels >0.3: raw / scaled |
|---|---|---|---|---|
| Retained water-flagged set | 636,771 | 0.05158 | 0.34618 | 0 / 362,674 |
| Valid-aerosol sensitivity subset | 1,771 | 0.02774 | 0.46381 | 0 / 1,602 |
As a deliberately illustrative test, apply the same threshold of 0.3 to both versions. None of the retained pixels exceeds it when the index is calculated directly from digital numbers. After conversion, 362,674 pixels, or 56.96% of the retained set, exceed it. The threshold is a way to expose the numerical consequence; it is not a recommended universal water classifier.
The aerosol flags are part of the result
Of the 636,771 retained pixels, 566,086, or 88.90%, have the interpolated-aerosol flag. Only 1,771 have a valid aerosol retrieval. That is a serious reason to limit interpretation of the reflectance itself. USGS documents that aerosol retrievals frequently fail over water and advises users to examine the aerosol-quality band.
Restricting the calculation to the 1,771 valid-aerosol pixels still changes the median from 0.028 to 0.464. This smaller sensitivity test supports the arithmetic point. It does not turn the broader scene into a validated aquatic-reflectance product or eliminate other sources of uncertainty.
The water designation also comes from the product’s quality flag. We have not independently surveyed each pixel. No water-area estimate, shoreline movement, dissolved-organic-matter concentration or suspended-sediment concentration follows from these counts.
The exact scene and selection
The source is Landsat 9 Collection 2 Level-2, WRS-2 path 020, row 024, acquired September 27, 2026 and processed September 28. Its full product identifier is LC09_L2SP_020024_20260927_20260928_02_T1. The public catalog item identifies the band files and their scaling metadata.
We requested a window bounded by 79.2° W and 78.8° W, and 51.3° N and 51.7° N, centered on Rupert Bay. GDAL selected the corresponding native-grid window in UTM zone 17N. The returned arrays have 1,457 rows and 966 columns at 30-meter sampling. Band 3 supplies green and band 5 supplies near infrared.
- Require QA_PIXEL bits 0 through 5 to be zero, excluding the flagged fill, dilated cloud, high-confidence cirrus, cloud, cloud-shadow and snow conditions.
- Require QA_RADSAT to be zero. Exclude aerosol fill and the high aerosol-level category.
- Retain pixels with QA_PIXEL’s water bit set and both band values in the USGS valid digital-number range, 7,273 through 43,636.
- Calculate both versions of the normalized difference on the same retained pixels. Apply the extra valid-aerosol requirement only for the sensitivity subset.
The USGS quality-band definitions explain the flags. Passing this explicit mask does not guarantee cloud-free or perfectly corrected observations. It defines which stored pixels enter this particular test.
Use the comparison as a processing check
The summary CSV contains both subsets and their counts. A second CSV provides 200 deterministic, evenly spaced entries from the retained pixels in row-major order, including original band values, scaled reflectances, both ratios and quality flags. That sample illustrates individual calculations; the reported medians use the full retained arrays.
To repeat the full test, obtain the five named bands from the public scene, apply the native-grid window and mask above, and calculate the same medians. USGS permits reuse of its public-domain Landsat data with source acknowledgment.
The practical lesson is specific: check both scale and offset before transferring an index calculation to a new product. Collection labels and band metadata are part of the measurement. For another worked example of product conventions affecting interpretation, see our MODIS classification-scheme audit.
Sources and data
Sources were checked on October 6, 2026. Observation dates, release dates and the source versions used in this comparison are identified above.
- NASA Earth Observatory: Rupert Bay, October 6, 2026
- USGS: Collection 2 scale and offset
- USGS: Landsat Collection 2 quality bands
- USGS: Collection 2 known issues
- Microsoft Planetary Computer: Landsat 9 scene metadata
- USGS: public-domain status of cloud-hosted Landsat data
Download B461-index-summary.csv (CSV) · Download B461-landsat-index-samples.csv (CSV)