Launch Watch · Launch Watch · Current evidence
Published
Webb’s debris-disk age comparison has an open-ended entry
A 21-system debris-disk table includes one age lower bound. Preserving it changes how the sample can be counted around a 300-million-year dividing line.
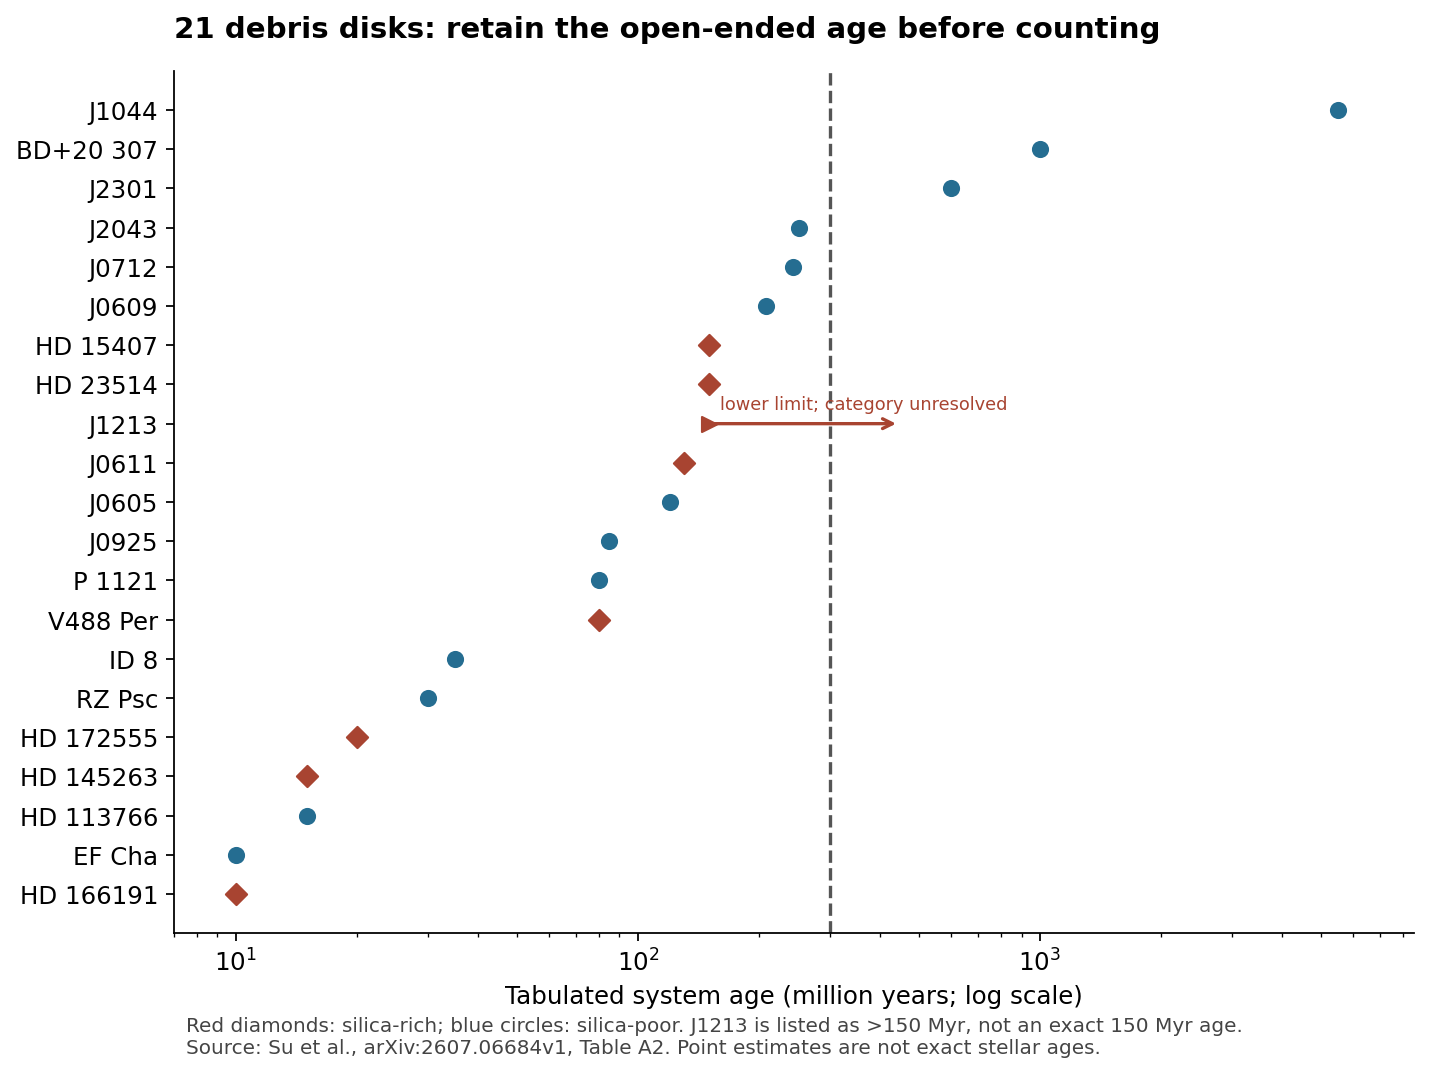
One of the 21 systems in the new extreme-debris-disk study has an age listed only as greater than 150 million years. Treating that entry as exactly 150 million years would put it on the younger side of a 300-million-year comparison without support from the table.
The distinction matters because the system, J1213, is classified as silica-rich. The study links dust mineralogy to different collision histories, and NASA’s October 1, 2026 release highlights the apparent concentration of silica-rich systems at younger ages. We preserved the inequality while rebuilding the sample’s age comparison.
Count the age fields without filling in the unknown
The reproducible source for this check is Table A2 of Su and colleagues’ accepted preprint, arXiv:2607.06684v1. It was posted July 7; the public NASA release followed on October 1. Identifying the version matters because this comparison uses that frozen table rather than claiming that a news release supplies every numerical input.
Seventeen rows have tabulated point estimates below 300 million years. Seven of those are silica-rich. Three rows have estimates above 300 million years, and all three are silica-poor. The remaining row is J1213: silica-rich, with an age lower bound of greater than 150 million years.
| Object | Tabulated age (million years) | Silica-rich? | Position relative to 300 million years |
|---|---|---|---|
| J1213 | >150 | Yes | Unassigned from this bound |
| J2301 | 600 | No | Above, by point estimate |
| BD+20 307 | 1,000 | No | Above, by point estimate |
| J1044 | 5,500 | No | Above, by point estimate |
The lower bound leaves both possibilities open. An age of 200 million years and an age of 500 million years would each satisfy “greater than 150.” Neither is a new estimate for J1213; they simply demonstrate why the bound alone cannot decide which side of 300 million years contains the system.
The authors explicitly discuss this caveat: J1213 could be older than 300 million years given its age uncertainty. Retaining an unassigned category therefore preserves information already present in the study. It does not introduce a newly discovered contradiction.
What the dust comparison is testing
The study examines mid-infrared spectra from Webb and Spitzer to compare extreme debris disks. Their dust features provide evidence about processed material and possible collision conditions. Silica-rich and silica-poor are classifications of the observed spectral properties, interpreted with physical models.
A useful age comparison must preserve both parts of each record: the mineralogical class and the kind of age information available. A point estimate, an uncertainty interval and an open lower bound carry different information. Reducing all three to a single plain number can make a clean-looking dividing line appear more definite than the inputs allow.
The other ages in the table also have source-dependent uncertainties. Our plot shows their tabulated estimates; it does not turn them into exact stellar ages. Nor does the presence of only three rows above 300 million years establish a representative sample of all older planetary systems.
A transparent sensitivity check
If J1213 were placed on the younger side, the displayed groups would become 8 silica-rich systems among 18 younger entries and none among 3 older entries. If it were placed on the older side, they would become 7 among 17 younger entries and 1 among 4 older entries. The actual lower-bound record does not choose between those placements.
These are alternative bookkeeping outcomes, not two competing measurements of the star’s age. They show why the defensible table has a third category. The published sample still supports further investigation of age and mineralogy; the simple count alone cannot establish a sharp physical cutoff.
Similarly, the study’s collision interpretation does not mean Webb photographed individual bodies colliding. Its spectral measurements and impact models address possible histories of dust-producing systems. The collision artwork accompanying the release is explicitly an artist’s concept.
Reproduce the inequality-preserving table
Take the object name, age field and silica-rich flag from all 21 rows of Table A2. Cross-check the mineralogical flag against the “silica rich” column in Table 1. Preserve the greater-than sign before converting a numeric string for plotting.
- Put point estimates below 300 million years in the first group.
- Put point estimates above 300 million years in the second group.
- Leave a lower bound unassigned when the allowed ages cross the chosen dividing line.
- Count the silica-rich entries within each group and keep the unassigned object visible.
The downloadable 21-row CSV retains the original age text, its numeric component, a lower-bound indicator, the silica class and the resulting group. The arrow in the figure starts at J1213’s lower limit and points toward older ages. It does not end at a measured upper limit.
Our independent contribution is this explicit handling of the age field and the resulting comparison. It is not a new estimate of collision rates or a population-level statistical test. For another example of how uncertainty structure affects a scientific comparison, see our GLODAP shared-uncertainty audit.
Sources and data
Sources were checked on October 6, 2026. Observation dates, release dates and the source versions used in this comparison are identified above.